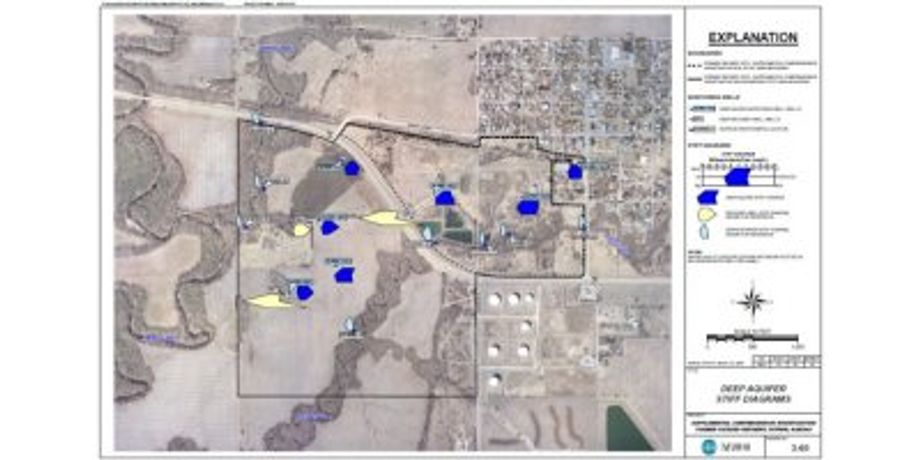
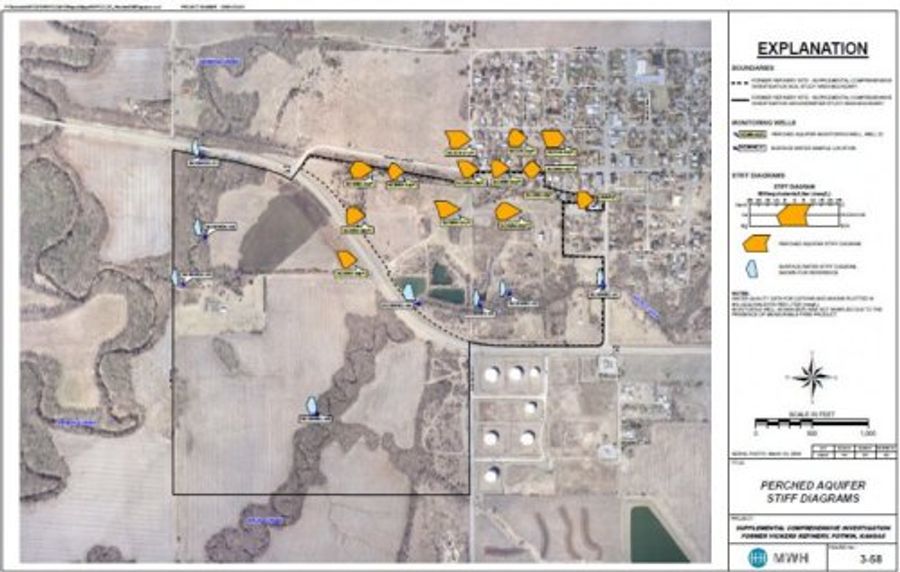
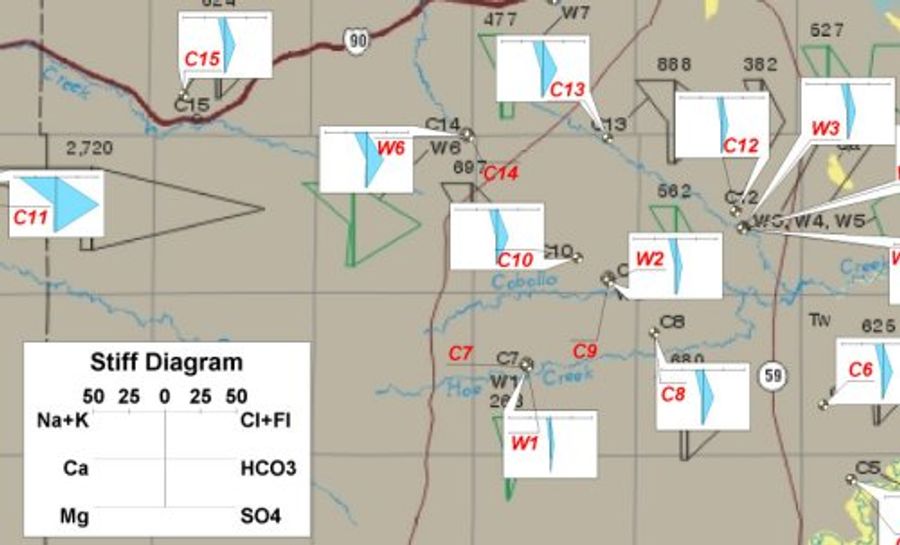
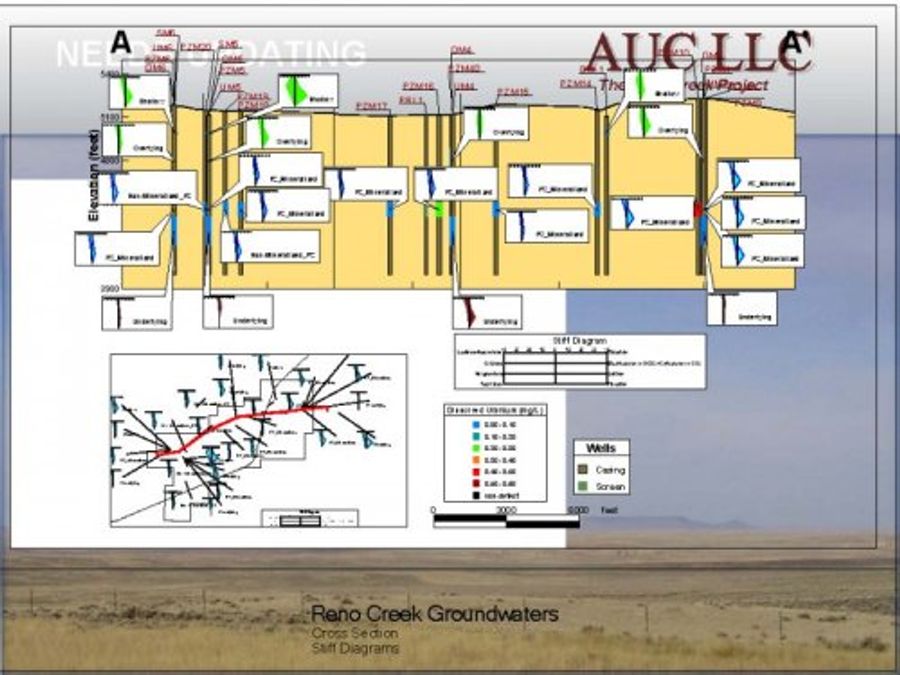
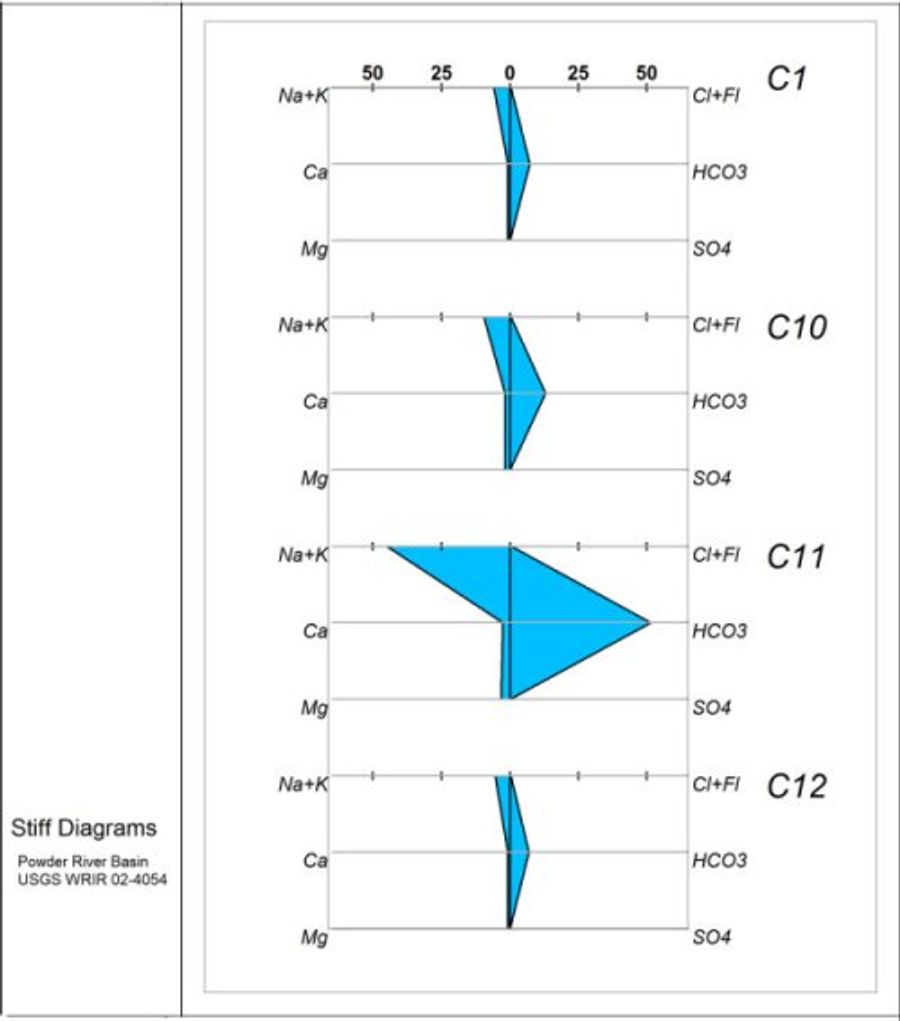
Geochemists over the years have developed a number of customized plots for analysis and presentation of geochemistry data. EnviroInsite has incorporated the most widely used of these plots allowing for the combined analysis of lithologic and chemical data. Mapped stiff diagrams and the presentation of stiff diagrams on x-sections is a unique enhancement available to EnviroInsite users. One of the key benefits is enhanced understanding of the direction and transport path of groundwater flow.
ArcGIS Online Services
EarthSoft`s status as an ESRI Business Parnter and their posession of an ArcGIS online subscription allows us to provide EnviroInsite users with access to three sets of online global maps served by ESRI. EnviroInsite users may now display topo maps, street maps and aerial images from this online source. The cost -- nothing!!
Preview of EQuIS Pro
Integration
This is a work in progress, but it`s looking very promising. Click here to see the EI-generated map delivered as a form inside...
Publish to the Web
EnviroInsite images can now be published to the web and viewed within dedicated web controls. From within the web control, one of the previously uploaded images can be selected and then layers turned on and off. Check out this link to a web page that hosts the dedicated control and this other link to a video that demonstrates how publish to the web. We`re looking for client input on the utility of this feature and how it might be expanded, so let us know if you have an interest in seeing...
Boring Log Key Map
EnviroInsite does maps and EnviroInsite does boring logs, but up until now EnviroInsite hasn`t done maps in boring logs. With this new feature, EnviroInsite grabs the view window from the home-tab plan view and places it in the boring log at the requested location and size. Thank you to the ERM UK office for funding this new feature.
Bar Charts
You can add bar charts to the set of tools you have available in EnviroInsite for display of multiple analyte concentrations. Bar charts in plan view have been implemented. Putting bar charts on x-sections is only a few clicks down the road.
Facelift for Tiled Charts
EnviroInsite`s time-history charts have been given a facelift to improve their presentation and ease of use. These multi-well or multi-analyte charts are by-far the easiest method out there to generate a set of time-history charts...
We invite you to join us at this workshop on fundamentals of EnviroInsite to be taught by EnviroInsite`s developer, Bruce Jacobs.Where: Mahwah, New JerseyWhen: July 25 and 26, 2016Cost: $99 for early birds that register before July 1 $250 for everyone else
Details
Contouring
Explore the methods used in 2d and 3d interpolation and contours. Topics to be covered include selection of interpolation methods and contouring options that allow you to best represent the underlying measured data field and evaluation...
Customer reviews
No reviews were found for Analyzing Geochemistry Software. Be the first to review!