- Home
- Companies
- Lakes Environmental Software
- Software
- Lakes Environmental - Ambient Quality ...
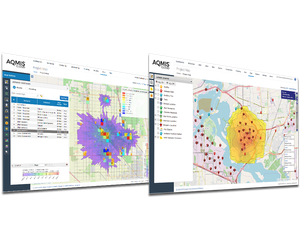
Lakes Environmental - Ambient Quality Management Information System (AQMIS)
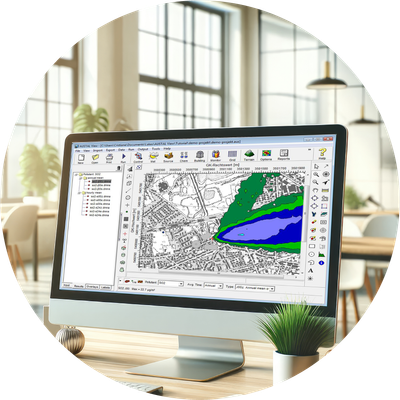
AQMIS, developed by Lakes Environmental Software, is an advanced environmental compliance solution designed to centralize all environmental data within your organization. By automating and streamlining complex tasks, AQMIS helps reduce operational costs and improve efficiency. The system (Ambient Quality Management Information System) consolidates environmental data, modeling tools, analytics, data visualization including mapping, and reporting into one seamless, online platform.
Offering a modular design, AQMIS allows users to easily expand its capabilities by adding new modules as needed, providing additional functionality and benefits. It is trusted by regulatory agencies, consultants, and industrial clients worldwide to accurately measure, analyze, and report emissions and conduct complex air quality studies. This combination of flexibility, scalability, and powerful features makes AQMIS a leading solution for environmental compliance and emissions management.
AQMIS, a trusted solution for regulatory agencies, consultants, and industries worldwide. It allows users to add modules as needed to meet their specific requirements, making it a leading choice for environmental compliance and emissions management.
- Eliminate Manual Workload
- Allows You to Detect Trends Instantly
- Reduce Your Stress with Automated Compliance
- Streamline Data Management
- Enhance Transparency and Accountability
- Simplify Complex Calculations
- Deploy Flexibly to Adapt to Your Workflow
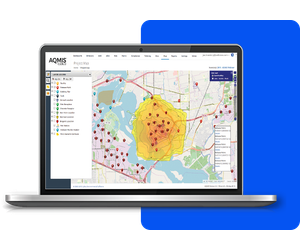
- Access Data Anytime, Anywhere
- Online Data Enty for Regulated Industry
- Automated Data Capture
- Real-time Analytics & Decision Support
- Automated Reporting & Documentation
- Centralized Data Management & Accessibility
- Improved Communication & Transparency
AQMIS offers a variety of modules specifically designed to meet and adapt to your unique needs.
Explore how AQMIS supports environmental agencies, regulated industries, and consultants with powerful solutions for effective environmental management. Discover its key applications and benefits today.
AQMIS is available through a one-time capital purchase for an enterprise perpetual license with annual maintenance and technical support due after the first year of ownership.
AQMIS is also offered through the SaaS purchase model. This subscription-based offering provides users a flexible, cloud-hosted solution with updates and support, paid on a monthly or annual basis.
Want to see AQMIS in Action?
AQMS offers a range of tailored solutions designed to address and adapt to your specific environmental management needs. Click the button below to request a demo and discover how our platform can support your objectives.