

Luminescence Thermometry with Upconversion Materials - Energy
Many upconversion luminescent materials emissive properties change as a function of temperature, pressure, or the presence of a chemical species. Such properties have long been exploited in the development of luminescence-based sensors. In this applicatio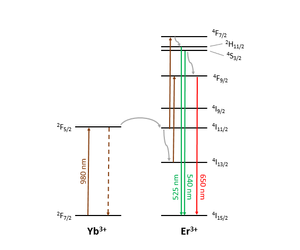
Many luminescent materials emissive properties change as a function of temperature, pressure, or the presence of a chemical species. Such properties have long been exploited in the development of luminescence-based sensors. Besides chemical sensing, luminescence thermometry is one of the most popular types of sensing. Unlike other methods, it does not require physical contact of a macroscopic probe with the region of interest. This is a huge advantage when access to the sample is difficult, and also in microscopy and biological samples. For example, luminescent nanoparticles can be functionalised to enter a biological target, and fluorescence microscopy can be used to accurately probe the temperature in different areas. This kind of nanometric thermometry has a lot of potential in the medical field, for example imaging cancer cells which have higher temperatures than the average.1
Luminescence thermometry can be based on changes in intensity, linewidth, photoluminescence lifetime, or spectral shifts. Very often lanthanide ions are used in temperature sensing applications, thanks to their stability and narrow spectral features that enable distinguishing changes easily.2 In addition, lanthanide-doped materials display upconversion luminescence: they can be excited with near-infrared (NIR) light, and emit in the visible region of the spectrum. NIR excitation induces less self-absorption and scattering by biological tissue; therefore remote excitation is easier. Thanks to this property there is an increasing number of temperature bioimaging studies using upconversion nanoparticles (UCNPs), inorganic nanoparticles doped with lanthanide ions.3
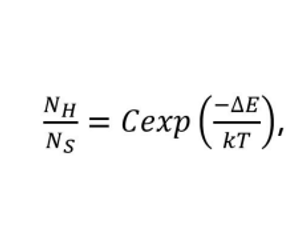
Figure 1 shows the upconversion mechanism for a common lanthanide-doped phosphor, NaY0.77Yb0.20Er0.03F4. At least two 980 nm photons are required to induce emission in the visible. Besides direct excitation of the Er3+ ion, there is energy transfer from excited Yb3+ to excited states of Er3+. Emission is in the blue, green and red regions of the visible spectrum depending on the upper Er3+ level in the transition.
Upconversion thermometry often focuses on the two transitions emitting at 525 nm and 540 nm, i.e. 2H11/2 → 4I15/2 and 4S3/2 → 4I15/2. The 2H11/2 and 4S3/2 levels are closely spaced in energy so they are effectively in thermal equilibrium. Their population ratio can therefore be expressed by a Boltzmann distribution:
Where Ni is the population in level i, ΔE is the spacing between the levels, k is Boltzmann’s constant and C is a constant depending on degeneracies.
Based on this, the ratio of 525 nm and 540 nm luminescence intensities, RHS, can be used to infer the ratio of 2H11/2 to 4S3/2, which gives the temperature of the sample. Photoluminescence spectrometers such as the Edinburgh Instruments FLS1000 can be used to characterise accurately this ratio as a function of temperature. In addition to widely used cryostats, the FLS1000 can be coupled to temperature controlled stages via fibres. Such stages enable studying the same sample in the FLS1000 and a microscope, without any intermediate sample mounting steps. This application note presents temperature-dependent upconversion luminescence results for NaY0.77Yb0.20Er0.03F4 obtained in an FLS1000 spectrometer coupled to a temperature stage.
A commercial upconversion phosphor, NaY0.77Yb0.20Er0.03F4 (Sigma Aldrich) was placed as supplied in a quartz tray inside a Linkam HFS350EV-PB4 stage. The stage was optically coupled to an FLS1000 Photoluminescence Spectrometer by means of a custom mount (N-Linkam) and a fibre coupling accessory for the sample chamber.
Steady state photoluminescence spectra were acquired using a Xe2 lamp for excitation at 980 nm, the excitation wavelength of Yb3+. The excitation power was low enough
not to induce sample heating, which is often observed with laser excitation.4 The FLS1000 was equipped with double monochromators and a standard PMT-900 detector.
Time-resolved photoluminescence decays were measured in the same instrument using a pulsed Xe lamp (µF2) as the excitation source. Multi-channel scaling (MCS) electronics were employed to acquire the decays, and the experimental data was fitted in the Edinburgh Instruments FAST software package.
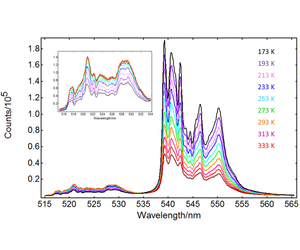
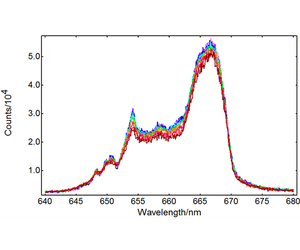
Red and green upconversion intensities were characterised from -100°C to +80°C in intervals of 20°C, using the temperature mapping option provided in the Fluoracle software. The results are presented in Figures 2 (green upconversion) and 3 (red upconversion). Two Er3+ transitions contribute to the green upconversion emission observed in Figure 2: 4S3/2 → 4I15/2 and 2H11/2 → 4I15/2. The red emission band in Figure 2 corresponds to the 4F9/2 → 4I15/2 transition. The emission intensity of 4S3/2 → 4I15/2 and 4F9/2 → 4I15/2 decreases with temperature, but the 2H11/2 → 4I15/2 band shows a different behaviour: it increases monotonically up to 273 K, and then the growth slows down.
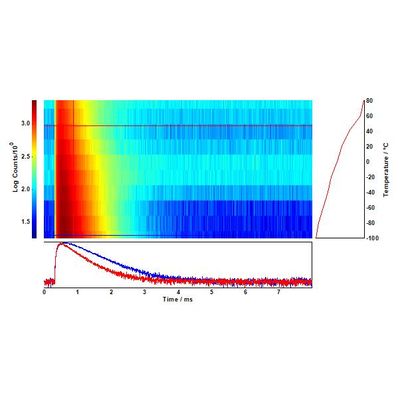
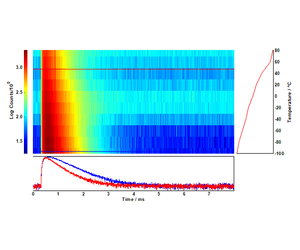
As the temperature increases, nonradiative relaxation processes decrease the overall upconversion luminescence. The dynamics of this temperature quenching process can be studied with a temperature lifetime map such as the one in Figure 4: there is a marked decrease in photoluminescence lifetime, from 640 µs to 530 µs, as T increases.
Returning to Figures 2 and 3, relaxation from 4S3/2, 2H11/2 to 4F9/2 produces a relative increase in red emission. This is illustrated by plotting the ratio of integrated intensities as a function of temperature Rrg, as shown in Figure 5 (a). The ratio of 2H11/2 → 4I15/2 to 4S3/2 → 4I15/2, RHS, is a good indicator of temperature as outlined in the introduction. Figure 5 (b) plots RHS against temperature, while Figure 5 (c) presents the same dataset in logarithmic form. Interestingly, RHS does not follow a straight Boltzmann plot: additional relaxation mechanisms take place and induce the “slow growth” behaviour of 4S3/2 → 4I15/2 at high temperatures. This agrees with previous reports5,6 and evidences the complex dynamics of the upconversion process: nonradiative relaxation from 2H11/2 to 4S3/2 becomes more important at high temperatures, so that the population ratio is not equal to RHS. It should also be noted that the RHS vs T depends strongly on the size of the particles.4,6
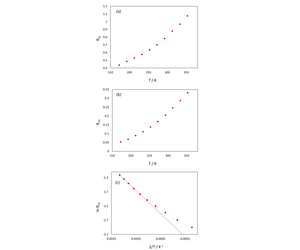
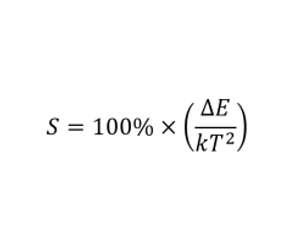
To illustrate the concept of upconversion thermometry, the low temperature region of the curve is fitted to a straight Boltzmann plot in Figure 5 (c). From this plot the relative sensitivity of the luminescence thermometry system, S, may be obtained. This is a useful parameter to evaluate a luminescence thermometer system, and is calculated as shown in the equation below.Taking the slope in Figure 5 as -∆E/k, the sensitivity at 20°C is 1.0% K-1. This result is in line with similar upconversion thermometry systems.3
The upconversion luminescence intensity and lifetime of NaY0.77Yb0.20Er0.03F4 has been characterised as a function of temperature using an FLS1000 Photoluminescence Spectrometer with a Linkam stage. The ratio of 2H11/2 → 4I15/2 to 4S3/2 → 4I5/2 can be used to probe the temperature in luminescence thermometry experiments with a sensitivity of 1.0% K-1. The fibre coupling accessory for the Linkam temperature stage enables one to switch easily between microscope characterisation and luminescence measurements, without intermediate sample transfer steps.
- C. D. S. Brites, et al., Nanoscale 4, 4799-4829 (2012)
- M. D. Dramianin, Methods Appl. Fluoresc. 4, 042001 (2016)
- M. González-Béjar and J. Pérez-Prieto, Methods Appl. Fluoresc. 3, 042002 (2015)
- S. Zhou, et al., Optics Communications 291, 138-142 (2013)
- X. Bai, et al., J. Phys. Chem. C 111, 13611-13617 (2007)
- W. Yu, et al., Dalton Trans. 43, 6139-6147 (2014)