- Home
- Companies
- Structural Vibration Solutions A/S
- Applications
- Operational and Experimental Modal ...

Operational and Experimental Modal Analysis Software for Rotating Machinery Sector - Manufacturing, Other
There are different ways to handle the problems arising from the harmonic components in the vibration measurements.
These can be divided as follows:
- Use harmonic detection to locate the harmonic peaks and then use this knowledge when estimating modes.
- Use a harmonic reduction approach to remove the harmonic peaks before a modal estimation.
- Use modal estimation techniques robust to the presence of harmonic componets in the measurements.
The optimal approach is to use a combination of the above tools. Below an real life example shows how the tools can be combined.
This case study demonstrates how the use of Harmonic Detection and Peak Reduction makes it easy to estimate modes from of a ship, even in the presence of significant harmonic excitation. The measurements and analysis presented here have been performed by University of Rostock, Faculty of Mechanical engineering. Chair of Technical Mechanics.
The measurements have been made under fully operational conditions; the responses are recorded using a 16 channel acquisition system and sampled with 128 Hz. Here the data has been analyzed up to 12.8 Hz as there are no modes of interest above this frequency.
One of the major challenges has been a severe harmonic peak very close to the resonance of one of the fundamental modes of the structure. Additional orders of this harmonic frequency are also very significant in energy. A higher order mode at 8.2 Hz is masked by the harmonics of the same frequency. The aim of this analysis is to remove the harmonic peaks that render the operational modal analysis of this data less effective, and to estimate the global modes of the ship.
The ship tested has the following technical specifications:
- Build at Flensburger Schiffbau Gesellschaft.
- Dimensions: length over all: 199.8 m
- Speed: 22.5 kn
- Main engine: 9L 60 MC-C (MAN B&W;, 9 cylinder)
- Power: 20.070 kW
- Speed: 123 rpm
- Working process: two-stroke
- 4-bladed propeller with controllable pitch

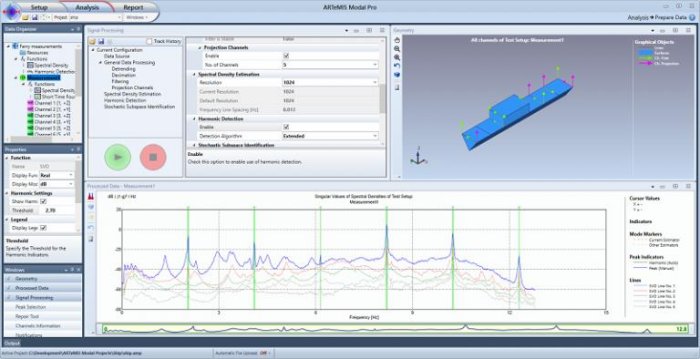
The first step is to use the harmonic detection available in ARTeMIS Modal. This detection loops through the measurement channels applying a sliding bandpass filter to determine the level of Kurtosis at different frequencies. In the Fast Detection approach only a few potential frequencies are evaluated, whereas in the Extended Detection approach all frequencies, available in the corresponding spectral density spectra, are evaluated.
If the Kurtosis at a frequency drops much below 3, then it is a sign that the data at this particular frequency isn’t normally distributed, which is the usual case of modal response from several independent input sources. In this case a green indicator is shown to signal that the data at this particular frequency might be from some rotating component rather than from a mode.
Below the Extended Detection has been applied. The green indicators are clearly showing at what frequencies the harmonic peaks are located.
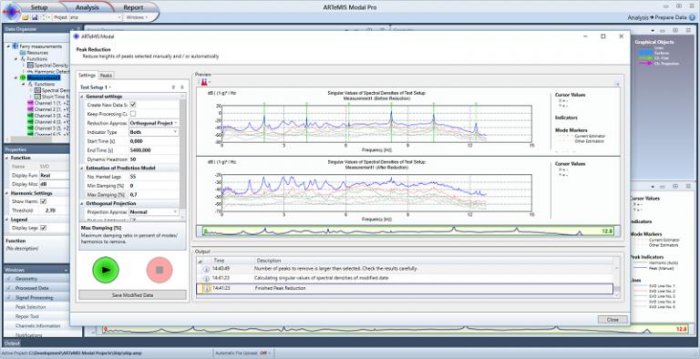
Step 2 – Reduction of Harmonic Excitation Peaks Once the most significant harmonic peaks have been identified, the second step is to perform a reduction of these peaks as well as other very lightly damped modes (less than 0.7%). The results of the harmonic peak reduction are illustrated on the figure below. The top diagram presents the Singular Values of the spectral densities of the original measurements as well as the six harmonic peaks to reduce. The bottom diagram shows the modified data after reduction.
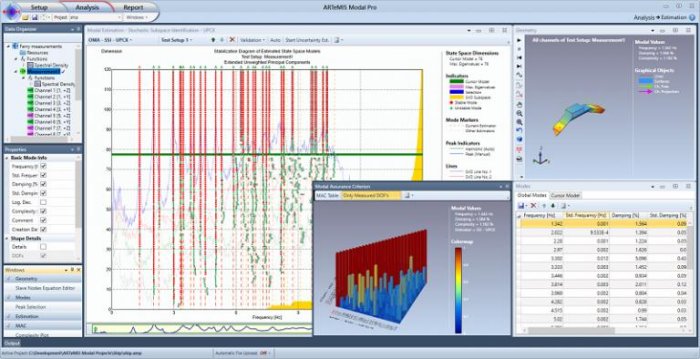
Estimation of the modes of the ship has been performed using the UPCX Crystal Clear SSI method with built-in uncertainty estimation of the modes. In this case state space models with dimension from 1 to 120 has been estimated and a stabilization diagram constructed as seen in the figure below. The global modes have then been automatically extracted from the diagram taking the estimated uncertainties into account. This allow a very accurate extraction of more than 25 modes in the selected frequency band.