

PISCES Conservation Ltd. software
Off-the-shelf Software
Pisces produce a very wide range of off-the-shelf software products for industry, working biologists and students, which are used all over the world.
Bespoke Software
Prediction of Inshore Saline Communities by Expert System (PISCES). In 2009/10 we worked with Cefas to update and improve our Prediction of Inshore Saline Communities by Expert System software, both tailor-made for Cefas`s own use, and as a stand-alone commercial application.
Pisces Conservation: Analytical Software Packages - Community Ecology
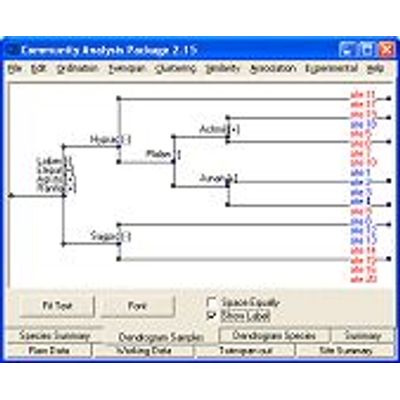
Model 6.3.4 - Community Analysis Package (CAP)
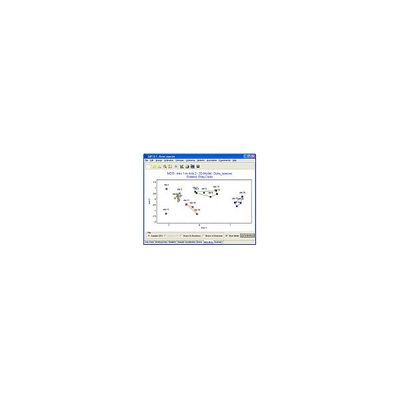
CAP 6 is a general multivariate analysis package for Windows PCs, with excellent graphics, suitable for undergraduate and post-graduate students and researchers in a wide range of sciences. Integration with R will be especially useful for under- and post-graduates, for whom the language is an ever-growing requirement. It is easy to use and affordable. It offers all the analytical techniques commonly used by community ecologists, and all other fields of research that use multivariate methods, including biology, geology, archaeology, anthropology, economics and sociology. It is particularly useful for ecological teaching because it allows students to quickly enter data, try different transformations, and explore a wide range of methods within a familiar Windows setting.
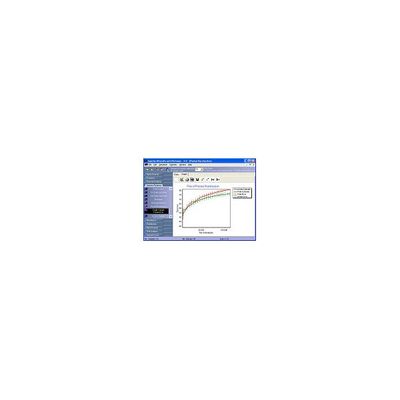
Model 4.1.2 - Species Diversity & Richness (SDR)
Over 70 methods just a mouse click away: Use the latest methods to gain insights into your data. SDR gives you a powerful suite of proven methods including some of the most exciting methods in modern ecology. With SDR, you can use all these methods, simply, quickly and easily. Unlocks the diversity of your data: With SDR you can explore multiple indices in a fraction of a second, compare the diversity or richness of any two samples, produce high quality graphics and discover patterns in your data. SDR is the tool that unlocks your data.
Applying Multivariate Methods using R, CAP and Ecom
This book, based upon our popular A Practical Handbook for Multivariate Methods (2008), is invaluable for anyone interested in multivariate statistics, and has been extensively revised to reflect the ever-growing popularity of R in statistical analysis. All the main multivariate techniques used in, Advertising, Archaeology, Anthropology, Botany, Geology, Palaeontology, Sociology. Zoology are clearly presented in a manner which does not assume a mathematical background.
Pisces Conservation: Analytical Software Packages - Statistics

Model 1.5.5.503 - QED Statistics Software
QED Statistics: An innovative Windows program for students, teachers and researchers... Are you looking for an easy-to use stats program? Do you want to know what your results mean? Do you want to know how the statistics are calculated? Do you get confused about which test to use, and how to interpret the results? If you answered YES to any of the above, then QED Statistics is the program for you! QED Statistics offers a comprehensive range of statistics, chosen to meet the needs of all students, researchers and post-grads wanting to analyse quantitative data. The program holds your hand, from data input, through single sample stats, right up to General Linear Models. Teachers & lecturers. With its easy-to-use interface, and familiar Windows feel, QED Statistics is the perfect teaching program. You can concentrate on the statistics and how to use them, rather than on how to use a complex stats program.
Model 2.0 - Fuzzy Grouping
Suitable for post-graduate students and researchers, Fuzzy Grouping is a Windows program offering fuzzy clustering methods that are now becoming used by community ecologists. Researchers in other fields such as palaeontology, archaeology and the social sciences may also use these methods. In ordinary cluster analysis a sample or site either belongs or does not belong to a particular group or set. We can score membership as a value of 1 and non-membership as 0. In fuzzy clustering a degree of membership can be assigned as a value between 0 and 1 so that a value of say 0.8 would indicate a high probability that the sample belonged to the particular group in question.