Airfield Systems, LLC
AirDrain for Sports Fields Brochure
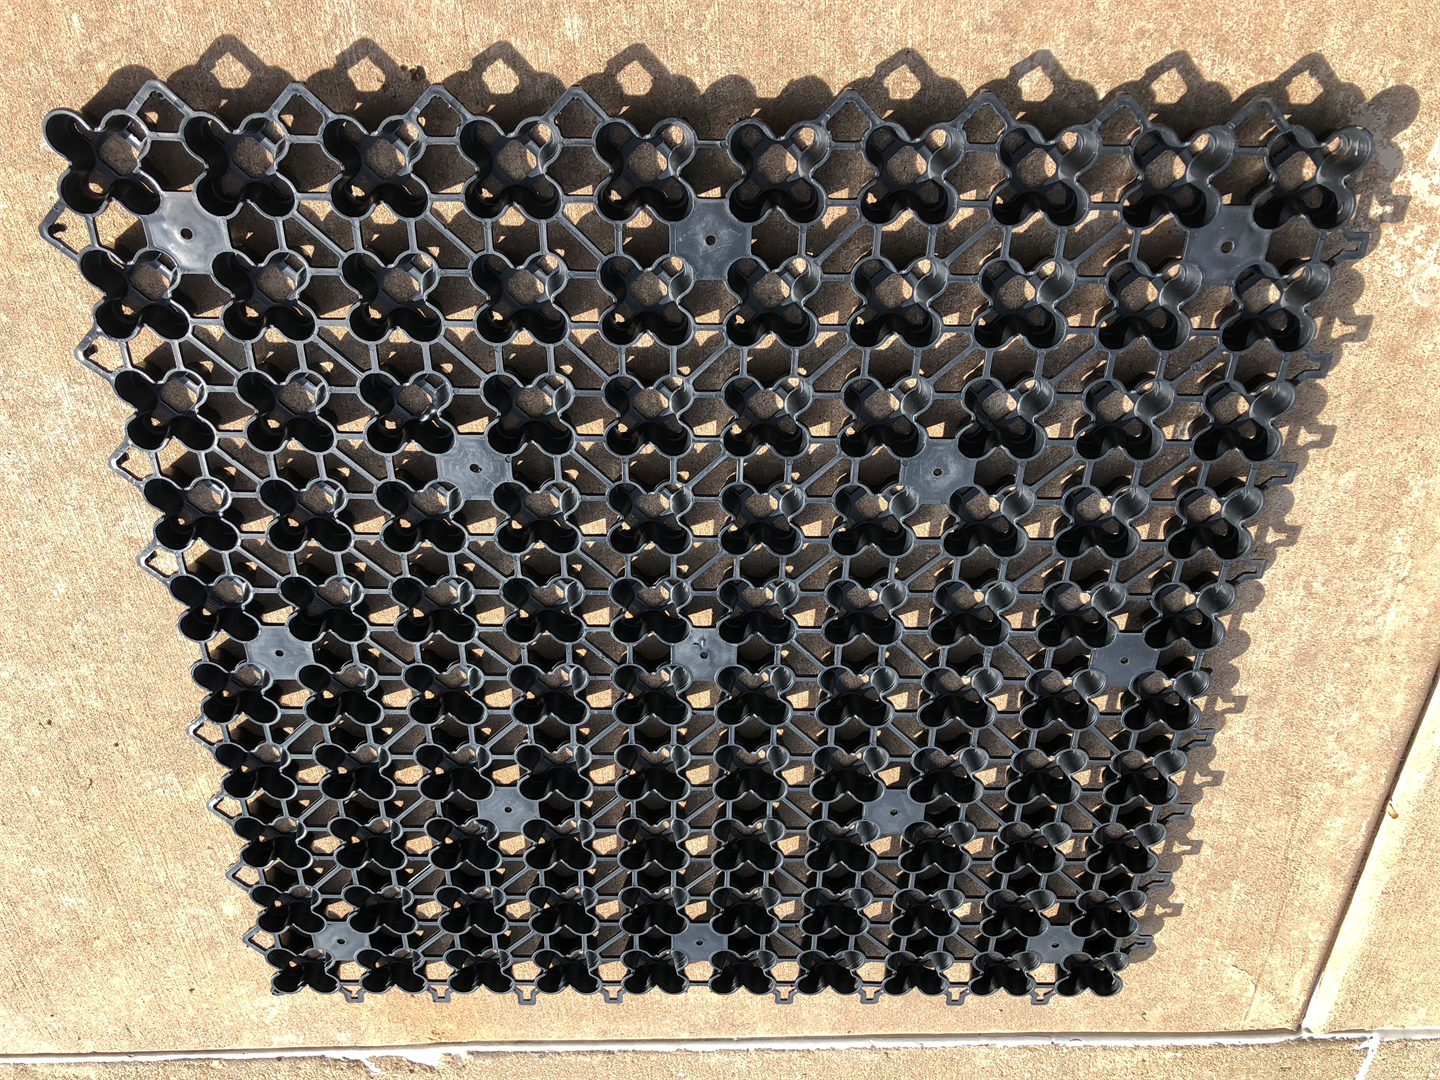
AirDrain – What drains better than Air? For Natural Turf Thru a research project conducted at Texas A&M, it was concluded that you can reduce your irrigation needs using AirField Systems AirDrain. The five year research project was jointly funded by the United States Golf Association and AirField Systems and was a collaborative effort between Texas A&M, AirField Systems and the United States Golf Association. The data from the research showed that the AirField Systems drainage profile provided between one to three more days of plant available water than a United States Golf Association recommended gravel and sand profile. Click here for more information about the study titled “A Comparison of Water Drainage and Storage in Putting Greens Built Using Airfield Systems and USGA Methods of Construction”. Benefits of an AirField System Design include: ? 1 to 3 more days of plant available water stored in the root zone (depending on climate) ? Significantly reduces daily irrigation needs (as told to us by our customers) ? Healthier turf / Stronger root system (as told to us by our customers) ? 100% Vertical Drainage under the entire playing surface ? AirDrain is a 100% recycled copolymer with the impact modifier “metallocene” qualifying it as a “No Break” plastic ? Helps eliminate standing water / Simplifies maintenance (as told to us by our customers) ? Minimal site disturbance / Far less excavation and disposal ? Several Installation days are saved over a gravel installation ? Compact shipping that reduces overall storage and transportation costs ? An AirDrain System sand profile creates its own perched water table Natural Turf 10”-11” Root Zone (USGA Spec Sand Profile) AirDrain’s Perched Water Table AirDrain Geocell Drainage Layer Filter Fabric Compacted Subgrade (Per Geotechnical Engineer) AirDrain Geocell Filter Fabric Filter Fabric (if Liner used) Impermeable Liner (optional) Note: The information in this article has been adapted from the original workpublished in Crop Science titled "Water Storage in Putting Greens Constructed withUnited States GolfAssociation and Airfield Systems Designs" (Mcinnes and Thomas,2011, 51:1261-1267) and in HortScience titled "Water Flow Though Sand-basedRoot Zones atop Geotextiles" (Rose-Harveyet aJ., 2012, 47:1543-1547). Theresearch was coJlaboratively funded by Texas A&M University, Airfield Systems(Oklahoma City, OK), and the United States GolfAssociation.Figure 1. The highly porous, I-inch deep AirDrain (right) offers analternative to the 4-inch deep gravel layer in the standard USGAputting green design (above left).zones.We became interested in the hydraulic performanceof the Airfield Systems design after Texas A&MUniversity constructed a soccer field with the AirfieldSystem design in 2002. Anecdotal evidence from fieldmanagers suggested that the new field required lessfrequent watering than the University's football fieldthat had been constructed following the USGA design.While the two fields were constructed with differentroot zone mixtures and the physical environmentssurrounding the fields are quite different, we suspectedthat there may have been a difference in the amount ofwater stored in root zones on fields constructed with thetwo designs (i.e., a difference in the verticaldistributions of water content in the root zones). Weknew from the physics of water in sand that the amountof water stored in a root zone decreaseswith increasing tension at the bottom of theroot zone, and we expected because of thegeometrical and physical differences in thedesigns that there would be differences inwater tension at the bottom of the rootAirField Systems GreenGeotextilePrelHued SUb-Base4-inch Gravel LayerAil'Oraill GeogridImperme.,hle lineror Geotextile ---'--=-"'..--- Natural TuffUSGA Putting GreenAirfield Systems offers an alternative to the standardUSGA putting green design. Their design utilizes ahighly porous, I-inch deep plastic grid (AirDrain,Figure 1) in place of a 4-inch deep gravel layer. As withgravel, AirDrain allows rapid lateral movement ofexcess water to drains and thus provides for uniformhorizontal moisture content within the root zone. Whilevoids in AirDrain are very effective in transmittingwater, they are much too large for the sand in the rootzone to bridge for self-support so a geotextile is usedatop the grid to prevent infilling of the void space. Useof geotextiles in putting green construction has beencontroversial due to the perceived potential forclogging of the fabric by migrating fine particles andeventual loss of permeability.©2013 by United States Golf Association. All rights reserved.Please see Policies for the Reuse of USGA Green SectionPublications.TERO Vol. 12(4):6-10 I July - August 2013TGIF Number: 2240576GRASS SURFACE---SPECIFIEDSAND ROOTZONE MIXPREPARED SUBGRADEPER GEO TECHNICALENGINEERS REPORTTo test for differences in tension developed at thebottom of the root zones of the two designs, weconstructed laboratory-based test cells from 4-inchdiameter PVC pipe containing profiles of the AirfieldSystems and USGA greens. Using tensiometers, wewere able to demonstrate that the tension thatdeveloped at the bottom of the root zone in the AirfieldSystems design was appreciably less than that in theUSGA design. At that point we thought it worthwhile toinvestigate this finding on a slightly larger scale and amore realistic setting. To this end, we constructed testgreens in 14-inch diameter PVC pipe. Three sands andthree gravels were chosen such that they covered theranges from coarser to finer sides of the USGArecommendations for particle size distribution. To createroot zone mixtures, the coarser two sands had peat mossadded to increase water retention. The finer sand was0.400.30this area representsthe amount of waterstored in the profile(about 3.5 inches)this area representsthe amount of waterstored in the profile(about 3 inches)0.200.10tension at bottom of profile =2.5 inchestension at bottom of profile =0.5 inchesVIQ).<::uc:N....VIQ).<::u.~N....top of root zonetop of root zoneO+---r--"""T""---.,..-----r--.---~-......._--+---'0.0016 -r---------------------,VI 12Q).<::u.~c:.~ 8c:~~'"3: 4VI 12Q).<::u2-c:.~ 8c:~'-~'"3: 4O=:::=;:==:::;:::==;::::::::::::;:::==::::;::::::::::::;:==:::;::::==w0.00 0.10 0.20 0.30 0.40Water Content (inch of water per inch of root zone)16 -r---------------------,Figure 2. Graphic representation of the dependenceof water-holding capacity on tension at the bottomof the profile for a typical root zone mixture meetingUSGA recommendation for total, air-filled, and ca-pillary porosities. The curved lines to the right rep-resent the relationship between water tension andwater content for the root zone mixture.While the root zone may be saturated above thedrainage layer, the water is under tension so the term"perched water table" often used to describe the stateof water in the root zone immediately above thedrainage layer is a bit of a misnomer. A better termmight be "perched capillary fringe." Capillary fringe isthe saturated zone above a water table where water isunder tension. The further upward from the bottom ofthe root zone the greater the water tension. As distanceincreases upward and water tension increases, the rootzone eventually begins to desaturate as the largestpores drain. As distance increases beyond this heightwater content continues to decrease. As a consequence,the tension that develops at the bottom sets the startingtension and determines the thickness of the saturatedzone and the amount of water stored in the root zoneprofile (Figure 2). The depth and hydraulic properties ofthe drainage layer determine the magnitude of tensionthat develops at the bottom of the root zone.AirDrain is l-inch deep so the maximum tension thatcan develop at the bottom of the root zone duringdrainage in the Airfield Systems design would be 1 inchof water. Gravel is typically 4 inches deep so the tensionthat could develop would be up to 4 inches of water,depending on the hydraulic properties of the graveland the depth to which sand ingresses pores of thegravel. Water is slow to drain from small pores intolarge pores, but if both systems were sealed fromevaporation the tensions would eventually reach 1 and4 inches at the bottom of the root zone in the AirfieldSystems and USGA design greens, respectively. Anoccasional finger of sand penetrating the gravel in theUSGA design green can lead to an appreciably quickerincrease in tension at the root zone gravel interface.Cross-section of a putting green using the AirDraininstead of a 4-inch gravel layer in a USGA green(Drawing courtesy of AirField Systems).©2013 by United States Golf Association. All rights reserved.Please see Policies for the Reuse of USGA Green SectionPublications.TERO Vol. 12(4):6-10 I July - August 2013TGIF Number: 2240577Figure 3. Test greens constructed in 14-inch PVC pipe with either gravel or geotextile atop AirDrain as thedrainage layers. Both types of test greens contained a pair of porous cups connected to plastic tubing thatformed manometer-tensiometers to allow measurement of water pressure or tension at the root zone-drainage layer interface.not amended. These three root zone mixtures wereused in combination with the three gravels to constructtest greens of the USGA design. The gravel layer in all ofthe test greens was 4 inches deep. An intermediatechoke layer of coarse sand was not used. The same threeroot zone mixtures were used in combination with fourgeotextiles atop AirOrain to construct test greens of theAirfield Systems design. We used the Lutradur polyestergeotextile prescribed by Airfield Systems at the timeand chose three additional geotextiles that had thesame apparent opening size (0.2 mm), but differed inmaterial and/or manner of construction. Manometer-tensiometers were used to measure pressure or tensionthat developed at the root zone-drainage layerinterface of both designs (Figure 3). After the test greencolumns were packed with 12 inches of the root zonemixtures they were sprigged with MiniVerdebermudagrass supplied by King Ranch Turfgrass-Wharton Farms (Wharton, TX). Following a period togrow-in the grass, a series of experiments wereconducted that measured the amount of water stored inthe root zone profiles and the water tension thatdeveloped at the bottom of the root zones of thedifferent treatments after irrigation and drainage.Vertically oriented time domain reflectometry TORprobes were used to measure the amount of waterstored in the root zone profiles (Figure 4).Periodically during the course of the study, the testgreens were watered until drainage was observed andthen the amount of water stored in the profiles and thewater tension at the bottom of the root zones wererecorded for 48 hours. As with our preliminary labstudy, we found that the water at the bottom of the rootzones of test greens constructed with the Airfield designwas under less tension than the water in test greensconstructed with the USGA design, by about 2.2 inchesof water tension (Figure 5). This lower tension wasassociated with an increase in water storage of about0.5 inch in the Airfield System design greens above thatin the USGA design greens (Figure 5). This increase inwater retention could lead to less frequent necessity toirrigate.Because of reduced tension at the bottom of the rootzone, these results also implied that the tension at whichroot zone mixtures should be tested for capillaryporosity when intended to be used in an Airfield Systemdesign green should be reduced to achieve similarFigure 4. Test green with vertically installed, 1-ftlong TOR probe used to measure average watercontent within the root zone profile.©2013 by United States Golf Association. All rights reserved.Please see Policies for the Reuse of USGA Green SectionPublications.8TERO Vol. 12(4):6-10 I July - August 2013TGIF Number: 224057moisture retention to greens built according to theUSGA recommendations. In doing so, slightly coarsersand would meet specifications for capillary waterretention in the Airfield design. Conversely, sands thatpush the very fine side of the current recommendationsmight not meet specifications for air-filled porosity.The question of whether or not geotextiles used in agreen will clog with fines migrating out of the root zonewas also studied. To address this issue, we conducted aFigure 5. Range in the mean amount of water storedin 12-inch root zone profiles in Airfield Systems(geotextiles atop AirOrain) and USGA (gravels)design test greens 12 hours after irrigation. Meanswere of the three root zone mixture treatments andvariations shown were from drainage-typetreatments (i.e., type of geotextile or gravel). Storedwater in the profile was measured by TOR and watertension was measured with manometer-tensiometers.year-long laboratory experiment to investigate a rangeof geotextiles that were suited to supporting sand in theAirfield System design and determine whether or notthey limit drainage out of the root zone. In thisexperiment, 6-inch diameter PVC columns were usedto contain combinations of 12 inches of three sandmixes with 10 geotextiles held atop AirOrain (Figure 6).Manometer-tensiometers again were used to measurepressure or tension at the sand-geotextile interfaces.Mix 1 had a particle size distribution that ran down thecenter of the USGA specs. Mix 2 was made by blendingMix 1 with a sandy clay loam (9: 1 by mass) and Mix 3was made by blending Mix 1 with a sand having excessfines (1: 1 by mass). Mix 1 and Mix 2 met USGArecommendations. Mix 3 contained twice therecommended amount of very fine sand. The apparentopening sizes of the geotextiles used ranged from 0.15to 0.43 mm. After the sands were added to the columnsthey were regularly irrigated. Periodically, the rate thatI-inch of irrigation water drained from a column wasmeasured and the pressure/tension at the sand-geotextile interface was recorded.For the first six months, any particles that washed outof the sand through the geotextiles were accumulatedand analyzed for total dry weight and particle sizedistribution. At the end of the study, the saturatedhydraulic conductivity of the sand-geotextilecombinations were measured. Statistical analysesshowed that drainage rate, saturated hydraulicconductivity, and mass of eluviated particles were notdependent on the properties of the geotextiles, butrather on the properties of the sands (Figure 7). Most allof the particles that washed out of the columns were ofclay and silt sizes. This could be construed as evidencethat the geotextiles were sieving out larger particles,but we found that the size of particles in the drainagewater was not related to the apparent opening size of3.50.5 1.0 1.5 2.0 2.5 3.0Water Tension at Bottom (inches of water)/T1\\\\\\v----t Airfield Systems design I~~II USGA design r'"1/t--2.50.03.2Vi 3.1C1l~uc: 3.0.S-.:: 2.9ea.c:-c 2.8~£Vl 2.7~'"~ 2.6Figure 6. Columns used to measure potential clogging of geotextiles by fines migrating out of the root zone.©2013 by United States Golf Association. All rights reserved.Please see Policies for the Reuse of USGA Green SectionPublications.TERO Vol. 12(4):6-10 I July - August 2013TGIF Number: 2240579• Water at the bottom of the test green rootzonesconstructed with the Airfield design was under lesstension than the water in test greens constructedwith the USGA design (about 2.2 inches of watertension).• This lower tension was associated with an increasein water storage of about 0.5 inch in the AirfieldSystem design greens above that in the USGAdesign greens.• Geotextiles with apparent opening size of 0.2 mmworked well in test greens and a woven geotextilewith an apparent opening size twice as large (0.43mm) retained the root zone sand just as well• The geotextiles that were tested prevented themigration and passage of the sand rootzonemixture into the drainage layer, but it appeared thatthe tested sands were responsible for determiningthe particle sizes leaving the columns.• The results gave no reason to prevent morewidespread use of Airfield Systems' design as analternative to the USGA method for putting greenconstruction.Summary PointsJAMES C. THOMAS, CPAg. is senior research associatein the Department of Soil and Crop Sciences at TexasA&M University.KEISHA M. ROSE-HARVEY graduate student in theDepartment of Soil and Crop Sciences, Texas A&MUniversity.DR. KEVIN J. MCINNES is Professor of Soil andEnvironmental Physics in the Department of Soil andCrop Sciences, Texas A&M University. His researchfocuses on water and energy transport in soil.pressure atop any of the geotextiles during drainage, aswould have occurred if the geotextile had beenrestricting drainage out of the column.In conclusion, the results of our studies gave noreason to prevent more widespread use of AirfieldSystems' design as an alternative to the USGA methodfor putting green construction. Airfield Systems designproduces additional water holding capacity above theUSGA design, which leads to more plant availablewater, given the same root zone mixture, and, possibly,less frequent requirement for irrigation. Our data alsosupport the general use of properly sized geotextiles tosupport sand based root zones in putting greens.Geotextiles with apparent opening size of 0.2 mmworked well in our test greens and a woven geotextilewith an apparent opening size twice as large (0.43 mm)retained the root zone sand just as well.0.10.0001 0.001 0.01Particle Diameter (mm)0.0 -i---.......~----+---'---+---~0.000011.0 .---------,------r----,...-----r------,"""'..,...Figure 7. Size distribution of particles washed out ofthe three sand mixes through the geotextiles. Thesolid line for each sand mixture represent the meanfraction of particles finer than a given diameter over30 columns containing the mixture (10 geotextileswith 3 replicates) and the dashed lines represent onestandard deviation each side of the mean.0.2 -i----t--+-1H+I1-IlJ'-~"-OJc 0.6 -i--+-+-1f-++u::co'':;u~ 0.4 +--+-+-irttmt-+t-t-:'h-rlt+---+-~"'M-Mt-~-t-:.+_rtlu.0.8 +--+-+-1f-t+the geotextiles, which it should have been if thegeotextiles were acting as sieves (i.e., the geotextileswith the larger AOS would have let larger particles pass,and vice versa, but this did not happen). The geotextilesobviously prevented the passage of particles as theirpurpose is to prevent migration of the root zone sandinto the drainage layer, but it appeared in our study thatthe sands were responsible for determining the particlesizes leaving the columns.Drainage rates from the columns containing the sandwithout added fines increased over the year,presumably because pore channels in the sand werewidened when silt and clay washed out of the profile.Drainage rates of the columns containing the two sandswith additional fines decreased over the year, but thedecrease was not statistically related to the properties ofthe geotextiles. To test if the sands themselves wereclogging, saturated hydraulic conductivities weremeasured as layers of sand were removed fromcolumns. Since saturated hydraulic conductivity wouldnot depend on the depth of sand in a hydraulicallyuniform column, any observed changes would be dueto difference in the conductivity of the layers removedcompared to those remaining. We found that whensurface layers were removed the saturated hydraulicconductivity increased, indicating that the surface layershad lower conductivities. This was not too surprising asthe majority of inter-particle pores of sand meetingUSGA recommendation are smaller than the apparentopening sizes of the geotextiles we tested. In support ofour conclusion that the sands were clogging and not thegeotextiles, we did not notice a build-up of positive©2013 by United States Golf Association. All rights reserved.Please see Policies for the Reuse of USGA Green SectionPublications.TERO Vol. 12(4):6-10 I July - August 2013TGIF Number: 22405710office depotHighlightoffice depotHighlightAirDrain – What drains better than Air? For Synthetic Turf The consistent Gmax and Shock Attenuation properties of the AirDrain are major contributors to the safety of your players and the reduction of concussions. Unlike traditional shock pads or e-layers AirDrain is 1” high has a 92% air void and a 100% vertical drainage rate which cannot be matched by any other product in the industry. AirDrain reduces Gmax by: (per Architect/Engineer) ? 18.9% on a gravel subbase ? 14.7% on a concrete subbase Some of the Benefits of an AirField Synthetic Turf Drainage System include: • AirDrain creates and helps maintain a constant Gmax for Synthetic Turf • ASTM testing proves AirDrain’s shock absorption properties reducing strain on joints and ligaments • Only needing a .25% slope for effective drainage • AirDrain is only limited by the drainage capacity of the profile above it and the exit drains capacity • AirDrain can be reused when the synthetic turf must be replaced Synthetic Turf/Infill/Backing AirDrain GeoCell Drainage Layer Filter Fabric AirDrain Geocell Cushion Layer Impermeable Liner Cushion Layer Compacted Subbase AirDrain – What drains better than Air? Green Roofing - Synthetic or Natural Turf With limited space on campus, high schools and colleges are turning to rooftop sports surfaces to create multi-use green areas. Building a rooftop sports ?eld with an AirField System provides drainage under 100% of the playing surface, prevents ponding, and moves water ef?ciently for reuse elsewhere on campus. Over 1,000,000 square feet of AirDrain rooftop drainage system installed and counting. Natural Turf- Chesapeake Energy 74,000 sqft. Synthetic Turf- Escuela Campo Alegre 76,000 sqft. and WPI “Worcester Polytechnics Institute” 174,000 sqft. Benefits of AirField in a green roofing system include: ? AirDrain creates and helps maintain a more consistent Gmax for Synthetic Turf ? ASTM testing proves AirDrain’s shock absorption properties reducing strain on joints and ligaments ? AirDrain can be reused when the Synthetic Turf must be replaced ? Can help qualify for LEED™ and other green building credits ? A smaller carbon and development footprint with reduced site disturbance ? Water harvesting reclamation and reuse is easy ? AirDrain is a 100% recycled copolymer with the impact modifier “metallocene” qualifying it as a “No Break” plastic. Making it able to withstand extreme heat and cold and still maintain performance. ? An AirDrain System sand profile creates its own perched water table without peat moss or clay ? Resins can be made to the following specification “Flammability UL 94, Flame Retardant, High Impact Polypropylene Copolymer Resins” Synthetic Turf 1” AirDrain System provides .576 gallons per sqft. of water storage or open space capacity for rapid drainage preventing surface ponding Geotextile Fabric Waterproof Sealed Roof per Architect/Engineer Geotextile Fabric Proper Sequencing and Orientation of AirDrain GeoCell Panels for Rapid Installation Pallet Staging: AirDrain pallets cover approximately 795sqft. per pallet and should be staged accordingly within the installation area so that you minimize the amount of time to stage the AirDrain grid along the install lines across the project. 1. Orientate the AirDrain GeoCell materials with the integral indicator tab to the panel's bottom left corner (painted yellow). Install the AirDrain units by placing units with the connectors and platforms up creating a flat surface for the profile above. 2. Install the AirDrain panels across the field in a rowed pattern. Staggering of rows will allow for multiple row completion by a multi-manned crew. 3. Once the first row has progressed across the project, start with a second row. Have a person staging the panels in three's snapped together along the row. The crew can then install the left side of the panel while elevating slightly the top portion ( so the male and female connectors don't sync ) once the left side has been snapped with a pull along the row direction, the top portion should fall into place and with a bottom vertical pull snap all three parts in place. 4. AirDrain panels can be shaped to individual field areas as needed with appropriate cutting device. A. If only a few parts need to be trimmed, use tin snips. B. If many parts require trimming, set up a table and use a circular saw with a no melt, plastic cutting saw blade. Visit www.AirFieldSystems.com to watch a video of a 74,000 sq ft project for Chesapeake Energy illustrating a 3 man crew installation. (Near the middle of page) DISCLAIMER: The preceding and following drawings and/or general installation guidelines are provided only to show a concept design for installation and are not instructions for any particular installation. These drawings and general instructions are not complete and are provided only to assist a licensed Geo-Technical Engineer, a Landscape Architect and/or Civil Engineer in preparing actual construction and installation plans. These drawings and instructions must be reviewed by a licensed Geo-Technical Engineer, a Landscape Architect and/or Civil Engineer and adapted to the condition of a particular installation site and to comply with all state and local requirements for each installation site. THESE DRAWINGS AND/OR GENERAL INSTRUCTIONS DO NOT MODIFY OR SUPPLEMENT ANY EXPRESS OR IMPLIED WARRANTIES INCLUDING MERCHANTABILITY AND FITNESS FOR A PARTICULAR PURPOSE, IF APPLICABLE RELATING TO THE PRODUCT. Synthetic Turf Athletic Fields built using AirField Systems AirDrain consistently outperform fields built over stone, concrete or asphalt, by reducing the Gmax and shock attenuation an average of 18.9% and 14.7%, and helps keep it there, for the life of the field. Multiple tests conducted by TSI Testing Services (an approved independent Test Laboratory by the Synthetic Turf Council) using ASTM F355-10a: Standard Test Methods for Shock-Absorbing Properties of Playing Surface Systems and Materials. Gravel Subbase: with the use of the filter fabrics and AirDrain with infilled synthetic turf reduced Gmax attenuation 18.9% versus Gmax attenuation which employed just the turf + infill system using the same sub base. Concrete Subbase: with the use of the filter fabrics and AirDrain with infilled synthetic turf reduced Gmax attenuation 14.7 % versus Gmax attenuation which employed just the turf + infill system using the same sub base. Player Safety The consistent Gmax and shock attenuation properties of AirDrain are a major contributor to the reduction of concussions and the safety of your players. Some factors that might influence a change in GMAX would be an inconsistency of the infill or wear of the synthetic turf fibers. Unlike traditional shock pads or e-layers the AirDrain is 1" high, has a 92% air void and a vertical and lateral drainage rate which cannot be matched by any other product in the industry. Removal, Recovery, Reuse & Recycling Once AirDrain has reached the end of its useful life, or “End of Life” (EOL) the owner may still benefit. AirDrain’s resins are of such high quality that most plastic recycling facilities will purchase the AirDrain panels on a per pound basis, thus benefiting the owner once more. AirField Systems can also help the owner in facilitating this process. Benefits of an AirField system include: ? AirDrain creates and helps maintain a constant Gmax for Synthetic Turf ? Shock absorption reduces the strain on joints and ligaments ? AirDrain can be reused when the Synthetic Turf must be replaced ? Can help qualify for LEED and other green building credits ? A smaller carbon and development footprint with reduced site disturbance ? Water harvesting reclamation and reuse is possible ? AirDrain is a 100% recycled copolymer with the impact modifier metallocene qualifying it as a “No Break” plastic ? AirDrain can be made to the following specification “Flammability UL 94, Flame Retardant, High Impact Polypropylene Copolymer, Black” for Rooftop applications OUR LETTERS AND REPORTS APPLY ONLY TO THE SAMPLE TESTED AND ARE NOT NECESSARILY INDICATIVE OF THE QUALITIES OF APPARENTLY IDENTICAL OR SIMILAR PRODUCTS, THESE LETTERS AND REPORTS ARE FOR THE USE ONLY OF THE CLIENT TO WHOM THEY ARE ADDRESSED AND THEIR COMMUNICATION TO ANY OTHERS OR THE USE OF THE NAME TESTING SERVICES, Inc. MUST RECEIVE OUR PRIOR WRITTEN APPROVAL. THE REPORTS AND LETTERS, AND OUR NAME, OUR SEALS, OR OUR INSIGNIA ARE NOT UNDER ANY CIRCUMSTANCES TO BE USED IN ADVERTISING TO THE GENERAL PUBLIC. VISIT OUR WEBSITE AT www.tsiofdalton.com TESTING SERVICES, INC. 817 SHOWALTER AVE. • P.O. BOX 2041 DALTON, GEORGIA 30722-2041 PHONE: (706) 226-1400 • FAX: (706) 226-6118 Test Report CLIENT: AirField Systems REPORT NUMBER: 56765 8028 N. May Avenue Suite 201 LAB TEST NUMBER: 2497-5010 Oklahoma City, OK 73120 DATE: November 30, 2012 PAGE: 1 of 2 Synthetic Turf Description: 46 oz/yd² Monofilament/Slit Film Fiber 2.25” Pile Height Monofilament / 2.125” Pile Height Slit Film 9.25 oz/yd² 3 Layer Primary Backing 25.1 oz/yd² Secondary Urethane Backing Infill System Installed: 3.0 lbs/ft² SBR Rubber Mixed with 1.25 lbs/ft² Silica Sand Underlayment #1: 10 oz Filter Fabric (Between Sub Base and Drain System) Drain System: Air Drain (Cups Down Against 10 oz Filter Fabric) Underlayment #2 4 oz Filter Fabric (On top of Flat Surface Air Drain, Under Turf) Sub Base: 2” Layer # 7 & # 81 Rock 1” Compacted Fines Layer Discussion: Testing Services Inc was instructed to carry out testing on the sample supplied according to the following testing: ? Comparative Gmax or cushioning properties between the turf and sub base system vs. the turf + Air Drain + Filter Fabrics and sub base. Material Received: 27 November 2012 Note: The above turf was selected from stock and its construction and infill properties are indicative a “typical” playing field for sports activity. Approved By: Erle Miles, Jr V.P., Testing Services Inc TSi Accreditation: Our laboratory is accredited with US Dept of Commerce, National Institute of Standards and Technology: ISO/IEC 17025:2005. Our code # is NVLAP 100108-0. TSi is also recognized as an approved Independent Test Laboratory by the Synthetic Turf Council. However, it should be noted that some or all of the tests performed are not under our scope of accreditation due to the work not fully conforming to the standard, or it being outside the scope of our accreditation, or subcontracted. Uncertainty: We undertake all assignments for our clients on a best effort basis. Our findings and judgments are based on the information to us using the latest test methods available. Testing Atmosphere: Unless otherwise noted, all testing was conducted under standard lab conditions of 20± 2ºC and 65 ± 4% r.h. OUR LETTERS AND REPORTS APPLY ONLY TO THE SAMPLE TESTED AND ARE NOT NECESSARILY INDICATIVE OF THE QUALITIES OF APPARENTLY IDENTICAL OR SIMILAR PRODUCTS, THESE LETTERS AND REPORTS ARE FOR THE USE ONLY OF THE CLIENT TO WHOM THEY ARE ADDRESSED AND THEIR COMMUNICATION TO ANY OTHERS OR THE USE OF THE NAME TESTING SERVICES, Inc. MUST RECEIVE OUR PRIOR WRITTEN APPROVAL. THE REPORTS AND LETTERS, AND OUR NAME, OUR SEALS, OR OUR INSIGNIA ARE NOT UNDER ANY CIRCUMSTANCES TO BE USED IN ADVERTISING TO THE GENERAL PUBLIC. VISIT OUR WEBSITE AT www.tsiofdalton.com TESTING SERVICES, INC. 817 SHOWALTER AVE. • P.O. BOX 2041 DALTON, GEORGIA 30722-2041 PHONE: (706) 226-1400 • FAX: (706) 226-6118 Report Date: 30 November 2012 Report #: 56765 Page #: 2 of 2 Client: AirField Systems Date of Test: 29 November 2012 Test Conditions: 61.5ºF 36% RH. Procedure: ASTM F355-10a: Standard Test Methods for Shock-Absorbing Properties of Playing Surface Systems and Materials ( Procedure A) Data obtained from this test method are indicative of cushioning properties of the playing surface system and materials under the specific conditions selected. The playing system is impacted at a specified velocity with a missile of given mass and geometry to determine the maximum value of G encountered during impact. The test set-up was positioned over the sub base with the clearview bumper II (gmax test equipment) placed level over the entire system. The missile was released, so as to impact the center of the assembly at a velocity of 3.43 m/s at a drop height of 24”. Three drops were made at 3 minute intervals. TThe procedure was repeated in three different locations for a total of nine drops. The first drop at each location was for assembly conditioning and was not included in the average. Test Data: Turf + Infill System Over Sub Base Location G-Max Read Drop #2 G-Max Reading Drop #3 Average G-Max Reading 1 93 95 94 2 96 101 99 3 89 92 91 OVERALL GMAX: 95 Test Data: Turf + Infill System + 4 oz Filter Fabric + AirDrain + 10 oz Filter Fabric Over Sub Base ? Location G-Max Read Drop #2 G-Max Reading Drop #3 Average G-Max Reading 1 74 77 76 2 76 79 78 3 76 79 78 OVERALL GMAX: 77 Conclusion: Use of the filter fabrics and AirDrain with infilled synthetic turf reduced Gmax attenuation 18.9% verses Gmax attenuation which employed just the turf + infill system using the same sub base. OUR LETTERS AND REPORTS APPLY ONLY TO THE SAMPLE TESTED AND ARE NOT NECESSARILY INDICATIVE OF THE QUALITIES OF APPARENTLY IDENTICAL OR SIMILAR PRODUCTS, THESE LETTERS AND REPORTS ARE FOR THE USE ONLY OF THE CLIENT TO WHOM THEY ARE ADDRESSED AND THEIR COMMUNICATION TO ANY OTHERS OR THE USE OF THE NAME TESTING SERVICES, Inc. MUST RECEIVE OUR PRIOR WRITTEN APPROVAL. THE REPORTS AND LETTERS, AND OUR NAME, OUR SEALS, OR OUR INSIGNIA ARE NOT UNDER ANY CIRCUMSTANCES TO BE USED IN ADVERTISING TO THE GENERAL PUBLIC. VISIT OUR WEBSITE AT www.tsiofdalton.com TESTING SERVICES, INC. 817 SHOWALTER AVE. • P.O. BOX 2041 DALTON, GEORGIA 30722-2041 PHONE: (706) 226-1400 • FAX: (706) 226-6118 Test Report CLIENT: AirField Systems REPORT NUMBER: 56765A 8028 N. May Avenue Suite 201 LAB TEST NUMBER: 2497-5010 Oklahoma City, OK 73120 DATE: December 7, 2012 PAGE: 1 of 2 Synthetic Turf Description: 46 oz/yd² Monofilament/Slit Film Fiber 2.25” Pile Height Monofilament / 2.125” Pile Height Slit Film 9.25 oz/yd² 3 Layer Primary Backing 25.1 oz/yd² Secondary Urethane Backing Infill System Installed: 3.0 lbs/ft² SBR Rubber Mixed with 1.25 lbs/ft² Silica Sand Underlayment #1: 10 oz Filter Fabric (Between Sub Base and Drain System) Drain System: Air Drain (Large Opening Up (Per Supplied Specs) Against 10 oz Filter Fabric) Underlayment #2 4 oz Filter Fabric (On top of Flat Surface Air Drain, Under Turf) Sub Base: Concrete Discussion: Testing Services Inc was instructed to carry out testing on the sample supplied according to the following testing: ? Comparative Gmax or cushioning properties between the turf and sub base system vs. the turf + Air Drain + Filter Fabrics and sub base. Material Received: 27 November 2012 Note: The above turf was selected from stock and its construction and infill properties are indicative a “typical” playing field for sports activity. Approved By: Erle Miles, Jr V.P., Testing Services Inc TSi Accreditation: Our laboratory is accredited with US Dept of Commerce, National Institute of Standards and Technology: ISO/IEC 17025:2005. Our code # is NVLAP 100108-0. TSi is also recognized as an approved Independent Test Laboratory by the Synthetic Turf Council. However, it should be noted that some or all of the tests performed are not under our scope of accreditation due to the work not fully conforming to the standard, or it being outside the scope of our accreditation, or subcontracted. Uncertainty: We undertake all assignments for our clients on a best effort basis. Our findings and judgments are based on the information to us using the latest test methods available. Testing Atmosphere: Unless otherwise noted, all testing was conducted under standard lab conditions of 20± 2ºC and 65 ± 4% r.h. OUR LETTERS AND REPORTS APPLY ONLY TO THE SAMPLE TESTED AND ARE NOT NECESSARILY INDICATIVE OF THE QUALITIES OF APPARENTLY IDENTICAL OR SIMILAR PRODUCTS, THESE LETTERS AND REPORTS ARE FOR THE USE ONLY OF THE CLIENT TO WHOM THEY ARE ADDRESSED AND THEIR COMMUNICATION TO ANY OTHERS OR THE USE OF THE NAME TESTING SERVICES, Inc. MUST RECEIVE OUR PRIOR WRITTEN APPROVAL. THE REPORTS AND LETTERS, AND OUR NAME, OUR SEALS, OR OUR INSIGNIA ARE NOT UNDER ANY CIRCUMSTANCES TO BE USED IN ADVERTISING TO THE GENERAL PUBLIC. VISIT OUR WEBSITE AT www.tsiofdalton.com TESTING SERVICES, INC. 817 SHOWALTER AVE. • P.O. BOX 2041 DALTON, GEORGIA 30722-2041 PHONE: (706) 226-1400 • FAX: (706) 226-6118 Report Date: 7 December 2012 Report #: 56765A Page #: 2 of 2 Client: AirField Systems Date of Test: 7 December 2012 Test Conditions: 68ºF 42% RH. Procedure: ASTM F355-10a: Standard Test Methods for Shock-Absorbing Properties of Playing Surface Systems and Materials ( Procedure A) Data obtained from this test method are indicative of cushioning properties of the playing surface system and materials under the specific conditions selected. The playing system is impacted at a specified velocity with a missile of given mass and geometry to determine the maximum value of G encountered during impact. The test set-up was positioned over the sub base with the clearview bumper II (gmax test equipment) placed level over the entire system. The missile was released, so as to impact the center of the assembly at a velocity of 3.43 m/s at a drop height of 24”. Three drops were made at 3 minute intervals. This procedure was repeated in three different locations for a total of nine drops. The first drop at each location was for assembly conditioning and was not included in the average. Test Data: Turf + Infill System Over Sub Base Location G-Max Read Drop #2 G-Max Reading Drop #3 Average G-Max Reading 1 102 105 104 2 110 112 111 3 110 112 111 OVERALL GMAX: 109 Test Data: Turf + Infill System + 4 oz Filter Fabric + AirDrain + 10 oz Filter Fabric Over Sub Base ? Location G-Max Read Drop #2 G-Max Reading Drop #3 Average G-Max Reading 1 90 93 92 2 91 95 93 3 92 96 94 OVERALL GMAX: 93 Conclusion: Use of the filter fabrics and AirDrain with infilled synthetic turf reduced Gmax attenuation 14.7 % verses Gmax attenuation which employed just the turf + infill system using the same sub base. DiGeronimo/Mikula Associates, LLC. Athletic Facilities Cranbury, New Jersey (609) 306-5091, Fax: (609) 655-0114 Sturbridge, Massachusetts 01566 Tel: (508) 347-5184, Fax: (508) 347-5911 May 18, 2010 Attn: Brad Burgner Bomel Construction 8195 East Kaiser Boulevard, Anaheim, CA Test Location: Los Angeles City College 805 North Vermont Ave Los Angeles, CA RE: Drain matt Testing at Los Angeles City College – Rooftop Athletic Field, Los Angeles CA Mr. Burgner: On May 18, 2010, DiGeronimo-Mikula Associates, L.L.C. (DMA) personnel conducted field testing of three selected drain matt products installed at the above athletic field project location. The purpose of the tests was to evaluate the shock absorbing characteristics of the synthetic grass field and compare the GMAX values of each drain matt product installed with the existing synthetic turf overlaying each system. The Standard Test Method for Shock-Absorbing Properties of Playing Surface Systems and Materials (ASTM F1936-98 American Football Field) testing locations and procedure were preformed. The tests were performed using a Triax 2000 A-1 Missile, tripod mounted Gmax registration unit (www.triax2000.com). This report presents background information on the test procedures, existing conditions, test results and observations. Background The ASTM F-355-95 and ASTM 1936-98 test methods covers the measurement of certain shock-absorbing characteristics, impact force-time relationships and rebound properties of playing surface systems. The test procedure utilized involves dropping a 20 lb. missile three times at the same location under a controlled consistent height of 24 inches. The Gmax testing was developed by NASA in association with the automotive industry to determine the magnitude of sustained force the human body (in particular, the head) could withstand before serious effects would occur. The G force, or acceleration of the mass that is applying the force, is correlated with the sustained duration of the force. As an example, a fighter pilot may be subject to G forces of as much as 8 times normal gravitational force (8 Gs) for up to several minutes at which time unconsciousness (a blackout) could occur. Relative to athletic fields, a player will encounter G forces of 100 to 200 G’s over a period of less than 10 milliseconds. It has been determined that a G force of 200 over a period of at least 10 milliseconds is considered concussion level. This is for a single encounter. It has been shown by studies conducted by the AMA, that repetitive blows or encounters of up to four to five during an event reduces the needs to 160 G’s. Drain matt Testing Results May 18, 2010 Page 2 of 2 In the early 70’s, the artificial turf companies started to use this standard (G < 200) to determine the safety of their carpet systems. The artificial turf needed to stay inside this envelope, so it was determined by the turf manufacturers that a drop height of 24-inches should be the standard. This particular drop height was established because the artificial turf systems would exceed the maximum allowable Gmax (> 200 G’s) with a drop of 30-inches or more. As the industry has grown in sports surfacing and playground safety surfacing, so has the performance of these synthetics. Playground surfaces are now required to meet shock absorbancy standards from minimum drop heights of 36-inches to as much as 8-feet. In addition, the old carpet systems were directly accountable for sports injuries related to the carpet itself. Injuries such as turf toe and foot lock, and ankle, knee and shoulder sprains and breaks occurred, along with carpet burns and abrasions that were season long. The new synthetic grass systems offer much better results; achieving Gmax values of less than 200 from drop heights as much as 48-inches. Existing Conditions • Turf - 2 1/2” Slit Film, in filled with 50% Green Rubber Infill and 50% Silica Sand. • Drain matt #1 – Sport Drain Max by 3R Recycled Foam. • Drain matt #2 - DBS Shock pad and Drainage System. • Drain matt #3 – Airfield Drainage Systems. All Three drainage/shock pads and turfs underlying substrate consist of a concrete deck/rooftop, coated with waterproof membrane and 10 millimeter geo-textile cloth. Test Summary Three consecutive drops were made at each location for each 24” drop height, at roughly 1.5 - 4 minute intervals. The results of the products and turf combination tested are outline in the attached report (pg 3). All three combinations of drain matt and synthetic turf are within the range stated within the ASTM F1936-98 specification. The data for the Head Injury Criterion (HIC) and Pmax, the velocity at impact (ft/sec) of the missile, are also shown on the table. DMA is here to assist you from evaluation of products through engineering design, testing and construction oversight to achieve a successful project. Yours truly, DIGERONIMO-MIKULA ASSOCIATES, L.L.C. David J DiGeronimo, STC, ASTM William J. Mikula, PE Field Operations Principal Attachments Project: Los Angeles City College - Drain Matt TestingReport Date: 05/18/2010 Field Testing Date: 05/18/10 Air Temperature: 62F, Surface Temp 62-F, DrizzleTRIAX 2000 - Data Acquisition and Analysis ReportTest Methods ASTM F 1936-98 Procedure ATest # Drop No. Drainmatt Tested Ft. / Sec. H.I.C Peak/Gmax Avg./Loc. Drainmatt Average1 1 11.7 204 842 11.7 236 903 11.7 241 952 4 11.7 223 875 11.7 262 966 11.7 270 983 7 11.7 166 718 11.7 172 739 11.7 174 734 10 11.7 172 7711 11.7 208 8512 11.7 217 885 13 11.7 169 7114 11.7 187 7615 11.7 195 786 16 11.7 222 8917 11.7 289 10518 11.7 292 1067 19 11.7 215 8720 11.7 275 10121 11.7 294 1058 22 11.7 249 9723 11.7 308 10924 11.7 333 117Sport Drain MAX Drop 1Average of Two 94.75Average of all Three 78.833977386.577105.5DMA /DiGeronimo-Mikula Associates, LLCSports Facilities Testing and Consulting5 Apple Hill Road, Sturbridge, MA 01566 (508)-347-5184 - Fax: (508)-347-591192.5Sport Drain MAX Drop 1Average of all Three 107.166DBS Drop 2DBS Drop 1DBS Drop 3AIRFIELD Drop 1AIRFIELD Drop 2AIRFIELD Drop 3103113 GMAX for Synthetic Turf with Reports.pdf 56765 TSI Testing Gmax on gravel.pdf Test Report 56765A TSI Testing Gmax on cement.pdf Test Report AF GMAX Testing LACC 2.14.2011.pdf LA City R.pdf RE: Drain matt Testing at Los Angeles City College – Rooftop Athletic Field, Los Angeles CA Background Existing Conditions sprea Sheet1
Most popular related searches