
PKL Technologies Inc.
- Home
- Companies & Suppliers
- PKL Technologies Inc.
- Downloads
- EPA Air Monitoring Tools and Techniques ...
EPA Air Monitoring Tools and Techniques Datasheet
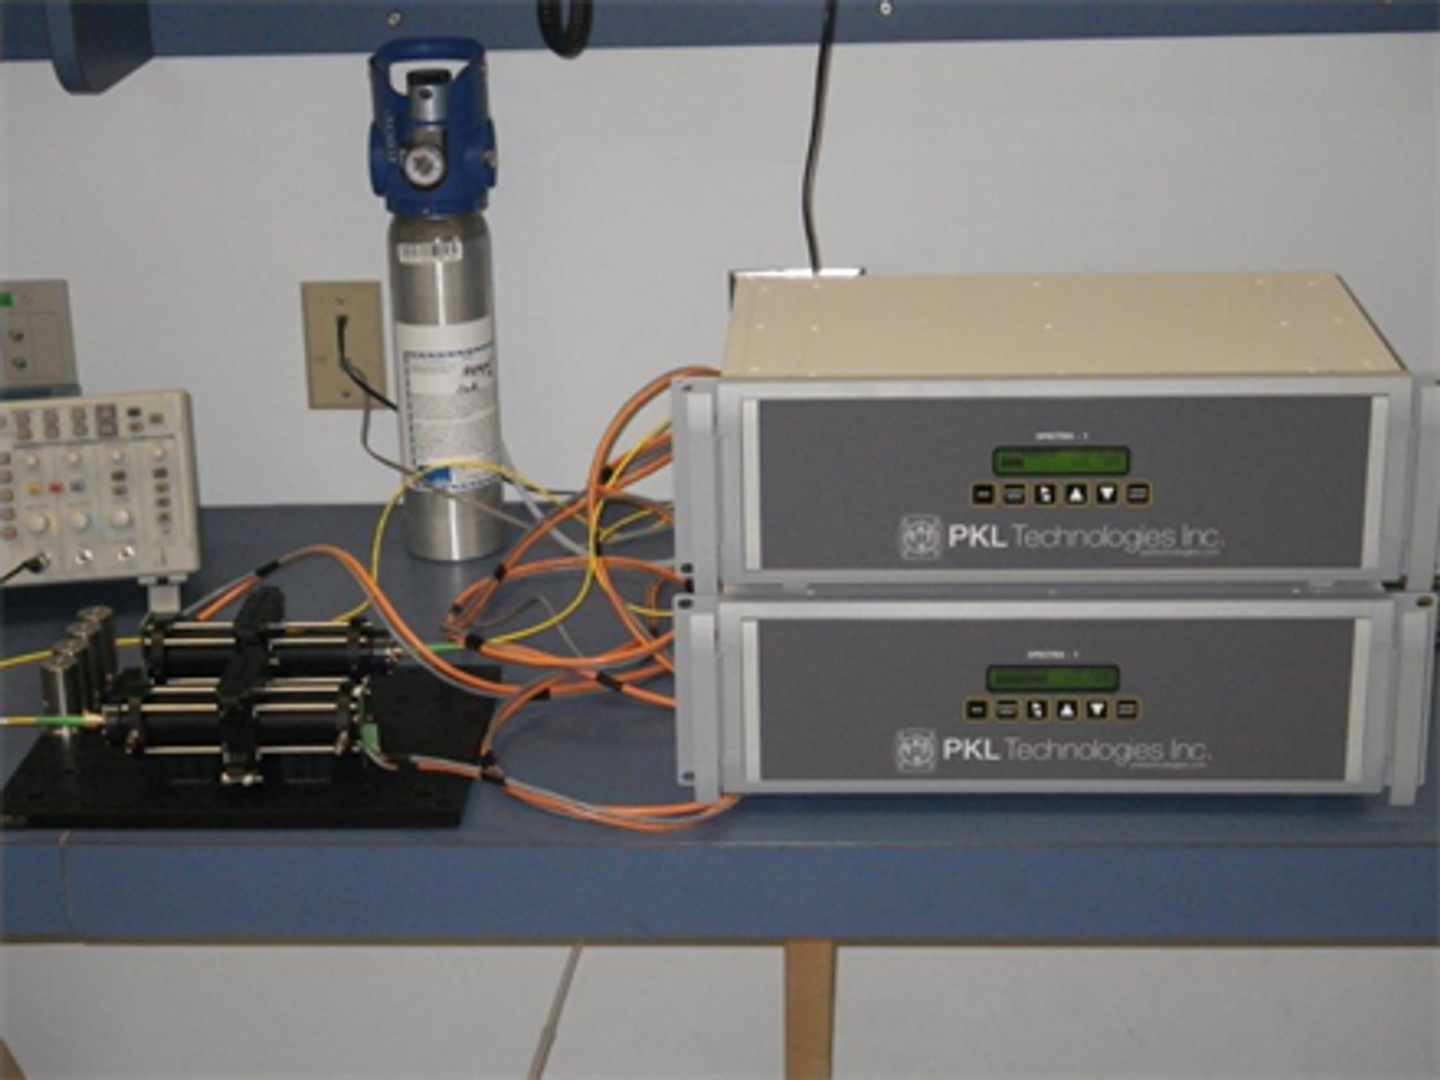
Air Monitoring Tools & Techniques Practical Applications for Savvy Air Investigators Outline Optical Remote Sensing (ORS) Tools: 1) Passive Fourier Transform Infrared (FTIR) 2) Ultraviolet Differential Optical Absorption Spectroscopy (UV-DOAS) 3) Open-Path FTIR (OP-FTIR) 4) Tunable Diode Laser (TDL) 5) Cavity Ring-Down Spectroscopy (CRDS) Readily Available Tools & Techniques 1) Photo-Ionization Detector (PID) 2) Gas Imaging Cameras 3) Air Monitoring Data Analysis Estimating Mass Emissions Rates: 1) EPA Other Test Method 10 (OTM-10) 2) Differential Absorption LIDAR (DIAL) PID: Photo-Ionization Detector • $4,000 to $6,000 per unit • Lamp Energy (usually 10.6 eV so no ethane or propane) lamp energy must > ionization potential • Benzene pre-treatment tube • Data Logging and alarms • Non-destructive (can collect air sample) • Photvac, RAE Systems & Ion Science • Location records (GPS or aerial imagery) • Identify locations for air sample collection EPA Region 6 PID Resources Craig Lutz PID: Photo-Ionization Detector Limitations: • Not suitable for detection of semi-volatile compounds. • Indicates if VOCs are present but does not identify type (unless combined with a pretreatment tube or gas chromatography). • May give false positive readings for water vapor. • Rain may affect operational performance. • High humidity can cause lamp fogging and decreased sensitivity. • High concentrations of methane can cause a downscale deflection of the meter. • Rapid variations in temperature at the detector, strong electrical fields, and naturally occurring compounds, such as terpenes in wooded areas, may affect instrument response. • Hand-held PIDs are not compound-specific unless pretreatment tube is used. Gas Imaging Cameras • Image example (visible vs. infrared image) • Digital video connection, USB, and a direct connection to charge the battery inside the camera • Contrast, polarity and brightness adjustments • High sensitivity mode • Alternate work practice • Integrated visual camera • Cost: ~$102,000 with telephoto and standard lens EPA Region 6 Gas Imaging Camera Resources Don Smith Thermal Infrared Camera Gas Imaging Cameras: Thermal IR Cameras VENDORS FLIR, Inc. www.flir.com Gas Imaging Technology, LLC http://www.gitint.com/ Leak Surveys, Inc. www.leaksurveys.com Gaseous Compounds that can be Detected by Thermal IR Cameras •Acetic Acid •Anhydrous Ammonia •Benzene •Butane •Carbon Monoxide •Chlorine Dioxide •Dichlorodifluoromethane •Ethane •Ethanol •Ethylbenzene •Ethyl Cyanoacrylate •Ethylene •Heptane •Hexane •Isoprene •Methane •Methanol •MEK •MIBK •Nitrous Oxide •Octane •Pentane •1-Pentene •Propane •Propylene •Sulfur Hexafluoride •Toluene •Xylene Gas Imaging Cameras: Thermal IR Cameras Gas Imaging Camera Limitations •Qualitative-no numerical “data” •Training required •Cannot be used during rain or fog •Not as effective during overcast skies •Specified nominal operating range for ambient temperature •Not intrinsically safe-use is limited in hazardous areas Gas Imaging Camera Strengths •Qualitative-relative size of each leak • Identification of the exact source of a leak •Real time detection results •Record leaks in a video format •Leak Detection from a Distance-identify leaking components in unconventional places with minimal exposure risk Air Monitoring Data Analysis • Helpful GIS layers (aerial imagery, Emissions Inventory, Toxics Release Inventory, parcel data) • GIS spatial analysis: distances, locations and directions • Fixed platform vs. mobile platform • Sample collection and PID surveys • Vector analysis • National Air Toxics Assessment (NATA) PID Survey Spatial Data Examples Northerly winds Light variable winds SDAF NDAF J323 J328 J327 J326 J324 J325 Aerial Imagery as a Screening Tool Aerial Imagery Resources Imagery and Mapping Services • Google Earth • Arc Explorer (ESRI) Need license for government use (EPA has ESRI license) Mosaic of best available imagery Meta data (date of image capture) may not be readily available Good for screening Aerial Imagery Resources • *US Geological Survey (USGS) Earth Explorer: http://earthexplorer.usgs.gov • *US Department of Agriculture (USDA) Geospatial Gateway: http://datagateway.nrcs.usda.gov/ • Texas Imagery, Texas Natural Resources Information System (TNRIS): http://data.tnris.org/datadownload/download.jsp • Arkansas Imagery: http://www.geostor.arkansas.gov/G6/Home.html • Louisiana Imagery: http://www.atlas.lsu.edu/ • New Mexico Imagery: http://rgis.unm.edu/ • Oklahoma Imagery: http://geo.ou.edu/DataFrame.htm *USDA and USGS data are also available through web-based applications in ArcMap (ESRI) Fixed Platform Monitoring Data • EPA: Air Quality System (AQS) Data Mart, some data sets not included, formatting issues – http://www.epa.gov/ttn/airs/aqsdatamart/index.htm • Louisiana Department of Environmental Quality (LDEQ): Daily Data by Site, no speciated PM or VOC data – http://www.deq.louisiana.gov/portal/DIVISIONS/Assessment/AirFieldServices/AmbientAirMonitoringProgram/AirMonitoringData.aspx • Texas Commission on Environmental Quality (TCEQ) – Texas Air Monitoring Information System (TAMIS), no AutoGC data http://www5.tceq.state.tx.us/tamis/index.cfm?fuseaction=home.welcome – Website: Multiple report options, some formatting limitations http://www5.tceq.state.tx.us/tamis/index.cfm?fuseaction=report.site_list – Geographical Texas Air Monitoring (GEOTAM) interactive map to display site information spatially http://gis3.tceq.state.tx.us/geotam/index.html Air Monitoring Data Analyses Methods Calculate Resultant Vector (useful when concentration data is 24-hr and wind data is hourly): • Associate wind speed and direction data with highest concentration data • resolve wind vectors into x (sin) and y (cos) components • Sum x components and y components, use tan to calculate resultant angle, and Pythagorean theorem for resultant magnitude • Compare results to prevailing/historical winds Air Monitoring Data Analyses Methods Exclude data for vector analysis (hourly concentration and wind data): use only data expected to have linear, stable and laminar flow Associate all concentration data with wind speed, wind direction and standard deviation (SD) of horizontal wind direction Exclude data where: – wind speed > 13 mph – SD of horizontal wind direction > 30 degrees – Daytime (10 am to 6 pm) Identify wind angles associated with elevated concentrations for spatial analysis Air Monitoring Data Analyses Methods After excluding data, identify wind directions associated with elevated concentrations (directional intensity is the average concentration for the wind bin divided by the average concentration for the site). Wind Angle (Degrees) Average Benzene Concentration (ppbv) 330-360 0.43 300-330 0.52 270-300 0.31 240-270 0.21 210-240 0.17 180-210 0.14 150-180 0.10 120-150 0.14 90-120 0.43 60-90 0.35 30-60 0.98 0-30 1.31 Wind Angle (Degrees) Average Benzene Concentration (ppbv) Directional Intensity Ratio 340-350 0.32 1.0 350-360 0.74 2.4 0-10 0.83 2.6 10-20 1.26 4.0 20-30 1.65 5.3 30-40 1.60 5.1 40-50 0.59 1.9 50-60 0.46 1.5 60-70 0.29 0.9 70-80 0.36 1.1 Spatial Data Analysis Identify monitor location Draw wind angle associated with elevated concentration data Add layer(s) with source data, such as land parcel ownership data, emissions inventory data, Toxics Release Inventory (TRI) data and/or aerial imagery 0 20 40 60 80 100 120 2005 2006 2007 2008 2009 2010 2011 ppbv Year Solar Estates AQS 483550041 CAMS 633 Hourly Ambient Sulfur Dioxide 4th Highest Hourly (Daily Maximum) Maximum Hourly NAAQS Note: Monitor does not meet EPA QA requirements. Trajectory Tool (Corpus Christi, TX only) http://www.utexas.edu/research/ceer/ccaqp/trajectory_tool.htm Air Monitoring Analysis Example: Geismar, LA and Corpus Christi, TX Data Element Corpus Christi Geismar NATA 2011, County or Parish Cancer Risk Contributors (point sources), ranked by risk, risk > 2 in one hundred million) Chromium, Benzene and Formaldehyde Ethylene Dichloride, Chromium, Ethylene Oxide, Benzene, Formaldehyde, Nickel, Vinyl Chloride, 1,3-Butadiene, Arsenic, Carbon Tetrachloride, Naphthalene, Ethylbenzene and Acrylonitrile NATA 2011, County or Parish Respiratory Hazard Contributors (point sources), ranked by hazard quotient (HQ), HQ > 0.1 Acrolein and Formaldehyde Acrolein, Formaldehyde and Acetaldehyde Air contaminants in bold are not monitored within fifteen miles of the community. 0 0.2 0.4 0.6 0.8 1 1.2 1.4 1.6 1.8 2006 2007 2008 2009 2010 2011 ppbv Year Nueces County, TX and Ascension Parish, LA Benzene Trend-Annual Averages Oak Park Solar Estates Palm Dona Park Huisache Hillcrest Ascension Linear (IRIS 10E-05 Cancer Risk Upper & Lower Bound) Air Monitoring Analysis Example: Geismar, LA and Corpus Christi, TX Air Monitoring Analysis Example: Geismar, LA and Corpus Christi, TX A spatial evaluation of the wind data associated with elevated ambient benzene concentrations in 2010 and 2011, considering monitor and benzene emissions source locations, indicates that the most significant contributing sources of elevated ambient benzene concentrations are refineries, specifically Valero Refining, East Plant, Flint Hills Resources, West Refinery and Citgo Refining, East Plant Air Monitoring Analysis Example: Geismar, LA and Corpus Christi, TX A spatial evaluation of the wind data associated with elevated ambient benzene concentrations at the Ascension Parish monitor (3-hr averages greater than 1 ppbv) in 2009, 2010 and 2011, considering the monitor location, indicates that the most significant contributing sources of elevated ambient benzene concentrations are located south-southwest of the monitor. Mobile Gas Chromatograph (GC) Platforms for VOC Analyses • Texas Commission on Environmental Quality: GC/Flame Ionization Detector (FID) Platform, Contact Ken Rozacky. • City of Houston: GC/Mass Spectrometry (MS)/FID Platform, Contact Don Richner. • Louisiana Department of Environmental Quality: GC/PID/electrolytic conductivity detector (ELCD) Platform, Contact David Wagenecht. • Environmental Response Team Center, EPA-Trace Ambient Gas Analyzer (TAGA): GC/MS Platform, Contact Melvin Ritter. Each platform can utilize additional equipment for other air contaminant monitoring. Trace Ambient Gas Analyzer (TAGA) Data “The use of the TAGA by a non-Superfund Program requires a buy-in to EPA’s ERTC.” Remote Quantification of Combustion Efficiency - Passive Fourier Transform Infrared (PFTIR) Spectroscopy • Hot gases from flares radiate spectra that are unique to each compound • A PFTIR is a spectrometer that can “see” the gas spectra from the ground • Measures CO2, CO and Hydrocarbon to calculate Combustion Efficiency • Flare Combustion Efficiency Tests (demonstrated importance of steam minimization): Various Marathon sites, Shell Deer Park Draft 29 Open Path Technologies Open-path technologies measure the average concentration of chemicals or particulates across an open path of air or line of sight. They do this by emitting a concentrated beam of electromagnetic energy into the air and measuring its interactions with the air’s components. UV DOAS UV-DOAS Vendors Websites Argos Scientific www.argos-sci.com Environnement S.A. Sanoa UV/Visable DOAS www.environnement-sa.com ETG Risorse e Tecnologia www.etgrisorse.com IMACC www.ftirs.com Opsis, Inc. www.opsis.se Spectrex www.spectrex-inc.com Cerex Monitoring Solutions www.cerexms.com Approximate Detection Limits for UV-DOAS Pollutant Lower Detection Limit (ppb) Path Length (m) Ammonia 4 150 Benzene single digit ppb 500 Carbon Disulfide 5 250 Formaldehyde single digit ppb 500 Nitrous Acid single digit ppb 500 Nitrogen Dioxide single digit ppb 1000 Nitrogen Oxide 10 150 Ozone single digit ppb 1000 Sulfur Dioxide single digit ppb 1000 Toluene single digit ppb 200 m,p-Xylene 10 500 o-Xylene 20 ppb 500 Can also measure 1,3-Butadiene with low-range IR detector (Opsis AR600), Acrolein, Chlorine, Ethyl Benzene, Hydrogen Fluoride, Styrene, Isoprene and Mercury UV DOAS UV-DOAS Strengths •Automated: Real- time measurements up to 24/7 continuous remote data •Economical: Relatively low instrument cost (about $60,000 - $200,000) •Low-cost long term deployment •Multiple Wavelength Operation: Monitoring of three species simultaneously. •Spectra can be saved and post analyzed •Long measurement path length – up to 500 m. Many compounds are detectable in the low ppb range UV-DOAS Limitations •Meteorological Limitations: Fixed observation area (winds). Affected by poor visibility conditions. •Limited Compounds: A number of species are undetectable by UV-DOAS •Application Limitations: Some models have difficulty aligning optics from multiple paths and long path lengths, making radial plume mapping more difficult (the Opsis 130 telescope has overcome this, it can move). UV DOAS Applications • Chlor Alkali Study: Olin Corporation in Augusta Georgia: Used UV-DOAS in 2000 to measure mercury emissions from a Chlor-Alkali plant (produces chlorine gas and sodium hydroxide by electrolysis using a mercury cathode). • Westlake Petrochemicals: Under a consent decree, a UV-DOAS system is being used for fence-line monitoring at the facility in Westlake, Louisiana. The data generated from this system, which is measuring primarily monoaromatics are made available to the public on an Internet webpage. A special condition of the decree requires the company to provide data to any nearby resident requesting it by the next business day following the request. • Cary Secrest, UV DOAS Expert, EPA OCE FTIR Open Path Can detect more than a hundred compounds, including: Acetylaldehyde Acrolein Acrylonitrile Ammonia Benzene 1,3-Butadiene Carbonyl Sulfide Halogenated Hydrocarbons Formaldehyde Hydrogen Chloride Hydrogen Cyanide Hydrogen Sulfide MEK Styrene Sulfur Dioxide Toluene Vinyl Chloride Xylenes Open Path FTIR Vendors OP-FTIR Instruments KASSAY FSI – *Ail Systems Inc. www.kassay.com *Spectrex, Inc. http://www.spectrex-inc.com IMACC Instruments http://www.ftirs.com/ MIDAC Corporation http://www.midac.com/ ruker Optics http://www.brukeroptics.com/opag.html ABB/Bomem http://www.abb.com/analytical OP-FTIR’s Strengths •Economical: Relatively low instrument cost (about $80,000 - $125,000). Low-cost long term deployment •Equipment is fairly rugged and easily portable •There are a large number of compounds that are infrared active (absorb IR light) •Large number of compounds can be analyzed simultaneously. •Spectra can be saved and post analyzed •No gas calibration standards necessary for field testing (uses standard reference spectral library), needed for laboratory confirmation of instrument performance and calibration. •Automated Real-time Measurements: Equipment can be allowed to run with minimal attention for months at a time with remote access to check instrument operation, schedule cryogen replenishment and recover data. •No sample collection, handling, or preparation is necessary *Verified by EPA’s Environmental Technology Verification Program Open Path FTIR OP-FTIR’s Limitations Spectral Interferences: Gas-phase water, CO and CO2 spectral interference. Diatomoic Molecules: Not applicable to homonuclear diatomic gases such as chlorine, oxygen, and nitrogen IR Wavelength Range and Interferences: Because of weak IR absorption features for many molecules, interferences and limited IR beam range, may not be sensitive enough to meet ambient data quality objectives for many species Path Length Range: Maximum path length is on the order of 400–500 meters Field Implementation Requirements: Typical infrared detectors require cryogenic cooling to operate, liquid nitrogen used for detector cooling must be refilled and maintained regularly (weekly), field implementation and data collection requires highly experienced personnel Setup Time Consuming and Costly: Typical set-up time usually requires about 5 to 8 hours and a minimum of two people, if multiple vertical or horizontal path measurements are necessary, can require significant time and cost to set up and implement. Measurement Limitations: Single beam open-path method measures concentration along a path. The path must capture most if not all of an analyte plume to provide accurate measure of emissions. FTIR Open Path Applications • Texas Petrochemicals: Settlement agreement with City of Houston requires OP-FTIR monitoring at north and south fence lines for 1,3-butadiene. • Houston Refining: Under Texas’ Audit Privilege, used OP-FTIR to measure total hydrocarbon and benzene emissions from delayed coker unit. Tunable Diode Laser *These compounds are not commonly measured; therefore detection limits are not readily available. Gaseous Compounds Measured by OP-TDL Systems Approximate ? (nm) Reported Detection Limit (ppm-m) ammonia 760, 1500 0.5-5.0 carbon monoxide 1570 40-1,000 carbon dioxide 1570 40-1,000 hydrogen chloride 1790 0.15-1 hydrogen cyanide 1540 1.0 hydrogen fluoride 1310 0.1-0.2 hydrogen sulfide 1570 20 methane 1650 0.5-1 nitric oxide 1800 30 nitrogen dioxide 680 0.2 oxygen 760 50 water 970, 1200, 1450 0.2-1.0 acetylene 1520 * ethylene 1693 * formaldehyde 1930 * hydrogen bromide 1960 * hydrogen iodide 1540 * nitrous oxide 2260 * phosphine 2150 * propane 1400, 1500, 1700 * OP-TDL Vendors Boreal Laser www.boreal-laser.com OPSIS AB www.opsis.se Leister Process Technologies, Axetris Division www.ir-microsystems.com Norsk Elektro Optikk (NEO, Norway) www.neo.no PKL Technologies, Inc. www.pktechnologies.com PSI Physical Sciences, Inc. www.tdlas.com www.psicorp.com Senscient www.senscient.com Simtronics group www.simtronics.eu Unisearch Associates, Inc. (Concord, Canada) www.unisearch-associates.com Tunable Diode Laser Tunable Diode Laser Strengths • Minimal maintenance required and no consumables. Potential for remote access and control and user friendly • High temporal resolution and real-time results • Stable multi-pass optical cell: High sensitivity, longer effective path lengths, insensitive to vibrations • Internal temperature and pressure controls: Minimal drift, frequent calibration unnecessary, immune to ambient relative humidity and temperature changes and laser intensity fluctuations • No sample pre-conditioning or treatment required before analysis. • Easy field deployment and installation, can use low power optical sources Tunable Diode Laser Limitations •Detects only one compound per laser, fewer measureable compounds, and limited sensitivity •limited to compounds with overtone absorbencies in the near- and mid-IR range •Dust and objects can block the optical path Cavity Ring-Down Spectrometer •Laser absorption spectrometry, measures optical extinction of compounds that scatter and absorb light in a closed sample path (longer effective sample path lengths for greater detection sensitivity) •Good for measurements of weakly-absorbing or highly-dilute atmospheric samples •Measures the rate of decay of light intensity exiting from an optical cavity rather than the change in light intensity •Current application involves methane detection from oil and gas operations in the DFW region Example list of CRDS detectable pollutants Methane-52 ppbv Acetylene-4 ppbv TNT-0.075 ppbv Chlorobenzenes-ppmv levels Ammonia-19 ppbv Mercury-0.01 ppbv Minimum detectable mixing ratio at 1s noise level CRDS Vendors Picarro, Inc. (CRDS) www.picarro.com Tiger Optics www.tigeroptics.com Los Gatos Research (ICOS) www.lgrinc.com Cavity Ring-down Spectrometer Air canister samples collected if methane is detected to determine other constituents. Soon, mini-UV DOAS instead. Vertical transects collected along the length of plume to get average concentration Cavity Ring-Down Spectrometer (CRDS) CRDS Strengths •Simple design: Minimal maintenance, no consumables, user friendly •Fast detector: High temporal resolution and real-time results •Stable optical cell: Insensitive to vibrations during measurements •Internal temperature and pressure controls: Frequent calibration unnecessary, immune to ambient changes (such as relative humidity and temperature) and laser intensity fluctuations •Direct sampling: No sample pre-conditioning or treatment required •Compact and can use low power optical sources: Easy field deployment and installation CRDS Limitations •May need to apply sample filtering components to avoid interferences •Lasers limitations: Only certain spectral ranges available •Mirrors are only able to reflect over a small wavelength range (about ± 15%) •Multiple species detection difficult •High quality lasers and mirror: drive up the cost of the instrumentation OTM-10 VRPM OTM-10 VRPM Applications • Chlor Alkali Study, Occidental Chemical, Muscle Sloals, Alabama: Used UV-DOAS and OTM-10 in 2006 to measure mercury emissions from a Chlor-Alkali plant (produces chlorine gas and sodium hydroxide by electrolysis using a mercury cathode). • Houston Refining: Under Texas’ Audit Privilege, used OP-FTIR and OTM-10 in 2010 to estimate total hydrocarbon and benzene emissions from a delayed coker unit. Graphic from NPL Differential Absorption Light Detection and Ranging (DIAL) DIAL Strengths •Provides spatially resolved pollutant concentration in two dimensions •Measurements are provided in a relatively short period of time •Deployable in many different applications and configurations, moveable •Can measure long path lengths (1 to 3 km) DIAL Limitations •Due to limited availability, DIAL systems used in North America are typically imported, which increases the expense •Chemical species that can be characterized are limited to those compounds with the unique chemical properties required to be detected •Only a few wavelengths are measured (spectral artifacts cannot be fixed or investigated) Species Measured by DIAL Sensitivity (1) Maximum Range (2) Benzene 10 ppb 800 m Sulfur Dioxide 10 ppb 3 km Toluene 10 ppb 800 m Ethane 20 ppb 800 m Ethylene 10 ppb 800 m Methane 50 ppb 1 km General Hydrocarbons 40 ppb 800 m Hydrogen Chloride 20 ppb 1 km Methanol 200 ppb 500 m (1) Concentration sensitivities from NPL for measurements of a 50 meter wide plume at a range of 200 meters, under typical meteorological conditions. (2) The range value represents the typical working maximum range for the NPL DIAL system. DIAL Applications • Tonawanda Coke: Coke oven site, July 2009 Test Order for Benzene Emissions, May 2010 • BP Texas City: Voluntary Study with TCEQ and EPA funding, Benzene and VOC emissions, July to August, 2007 • Shell Deer Park: Voluntary Study with EPA, Environment Canada and City of Houston funding, Benzene and VOC emissions, January to March, 2010 DIAL Vendors Spectrasyne http://www.spectrasyne.ltd.uk/ LASEN http://www.lasen.com/ National Physical Laboratory http://www.npl.co.uk/ ITT http://www.itt.com/ Tonawanda Coke DIAL Data Example References • Federal Remediation Technologies Roundtable, Field Sampling and Analysis Technologies, Matrix Version 1.0, Accessed April 25, 2012 http://www.frtr.gov/site/6_2_1.html • EPA Handbook: Optical Remote Sensing for Measurement and Monitoring of Emissions Flux, U.S. Environmental Protection Agency, Office of Air Quality Planning and Standards, Air Quality Analysis Division, Measurement Technology Group, December 2011, http://www.epa.gov/ttn/emc/guidlnd/gd-052.pdf • The National Air Toxics Assessment, U.S. Environmental Protection Agency, March 2011 http://www.epa.gov/nata2005/ • The Integrated Risk Information System, U.S. Environmental Protection Agency, http://cfpub.epa.gov/ncea/iris/index.cfm?fuseaction=iris.showSubstanceList • Final Analytical TAGA Report, Urban Air Toxics Study in Harris County, U.S. Environmental Protection Agency, Emergency Response Team/Lockheed Martin, March 2007 • Marathon Petroleum Company, LP and Cattlets Refining, LLC Settlement Information Sheet, April 2012, http://www.epa.gov/compliance/resources/cases/civil/caa/marathonrefining.html References • Shell Deer Park Refining LP, Deer Park Refinery, East Property Flare Test Report by Shell Global Solutions (US) Inc., April 2011, http://www.tceq.texas.gov/assets/public/implementation/air/rules/Flare/2010flarestudy/sdp-epf-test.pdf • Tonawanda, NY DIAL Study Results, U.S. Environmental Protection Agency, Region 2, September 2010, http://www.epa.gov/region02/capp/TCC/tonawanda_docs.html • Characterization of Mercury Emissions at a Chlor-Alkali Plant, U.S. Environmental Protection Agency, Office of Research and Development, National Risk Management Research Laboratory, January 2002, http://www.epa.gov/region05/mercury/pdfs/Chloralkalireport.pdf • Measurement of Total Site Mercury Emissions for a Chlor-Alkali Plant Using Open-Path UV-DOAS, U.S. Environmental Protection Agency, Office of Research and Development, National Risk Management Research Laboratory, July 2007, http://nepis.epa.gov/Exe/ZyPURL.cgi?Dockey=P1009COE.txt • Other Test Method 10 (OTM 10) - Optical Remote Sensing for Emission Characterization from Non-Point Sources, U.S. Environmental Protection Agency, Technology Transfer network, Emissions Measurement Center, June 2006, http://www.epa.gov/ttn/emc/prelim/otm10.pdf Air Monitoring Tools & Techniques Outline PID: Photo-Ionization Detector PID: Photo-Ionization Detector Gas Imaging Cameras Thermal Infrared Camera Gas Imaging Cameras: Thermal IR Cameras Gas Imaging Cameras: Thermal IR Cameras Air Monitoring Data Analysis PID Survey Spatial Data Examples Slide Number 11 Aerial Imagery Resources Aerial Imagery Resources Fixed Platform Monitoring Data Air Monitoring Data Analyses Methods Air Monitoring Data Analyses Methods Slide Number 17 Air Monitoring Data Analyses Methods Slide Number 19 Slide Number 20 Slide Number 21 Air Monitoring Analysis Example: Geismar, LA and Corpus Christi, TX Slide Number 23 Air Monitoring Analysis Example: Geismar, LA and Corpus Christi, TX Air Monitoring Analysis Example: Geismar, LA and Corpus Christi, TX Air Monitoring Analysis Example: Geismar, LA and Corpus Christi, TX Mobile Gas Chromatograph (GC) Platforms for VOC Analyses Trace Ambient Gas Analyzer (TAGA) Data Remote Quantification of Combustion Efficiency - Passive Fourier Transform Infrared (PFTIR) Spectroscopy Open Path Technologies UV DOAS UV DOAS UV DOAS Applications FTIR Open Path Open Path FTIR Open Path FTIR FTIR Open Path Applications Tunable Diode Laser Tunable Diode Laser Cavity Ring-Down Spectrometer Cavity Ring-down Spectrometer Cavity Ring-Down Spectrometer (CRDS) OTM-10 VRPM OTM-10 VRPM Applications Slide Number 45 Slide Number 46 DIAL Applications Slide Number 48 References References
Most popular related searches