
Ogawa & Company, USA, Inc.
- Home
- Companies & Suppliers
- Ogawa & Company, USA, Inc.
- Downloads
- Protocol for NO-N0x, N02, S02 (PDF 497 ...
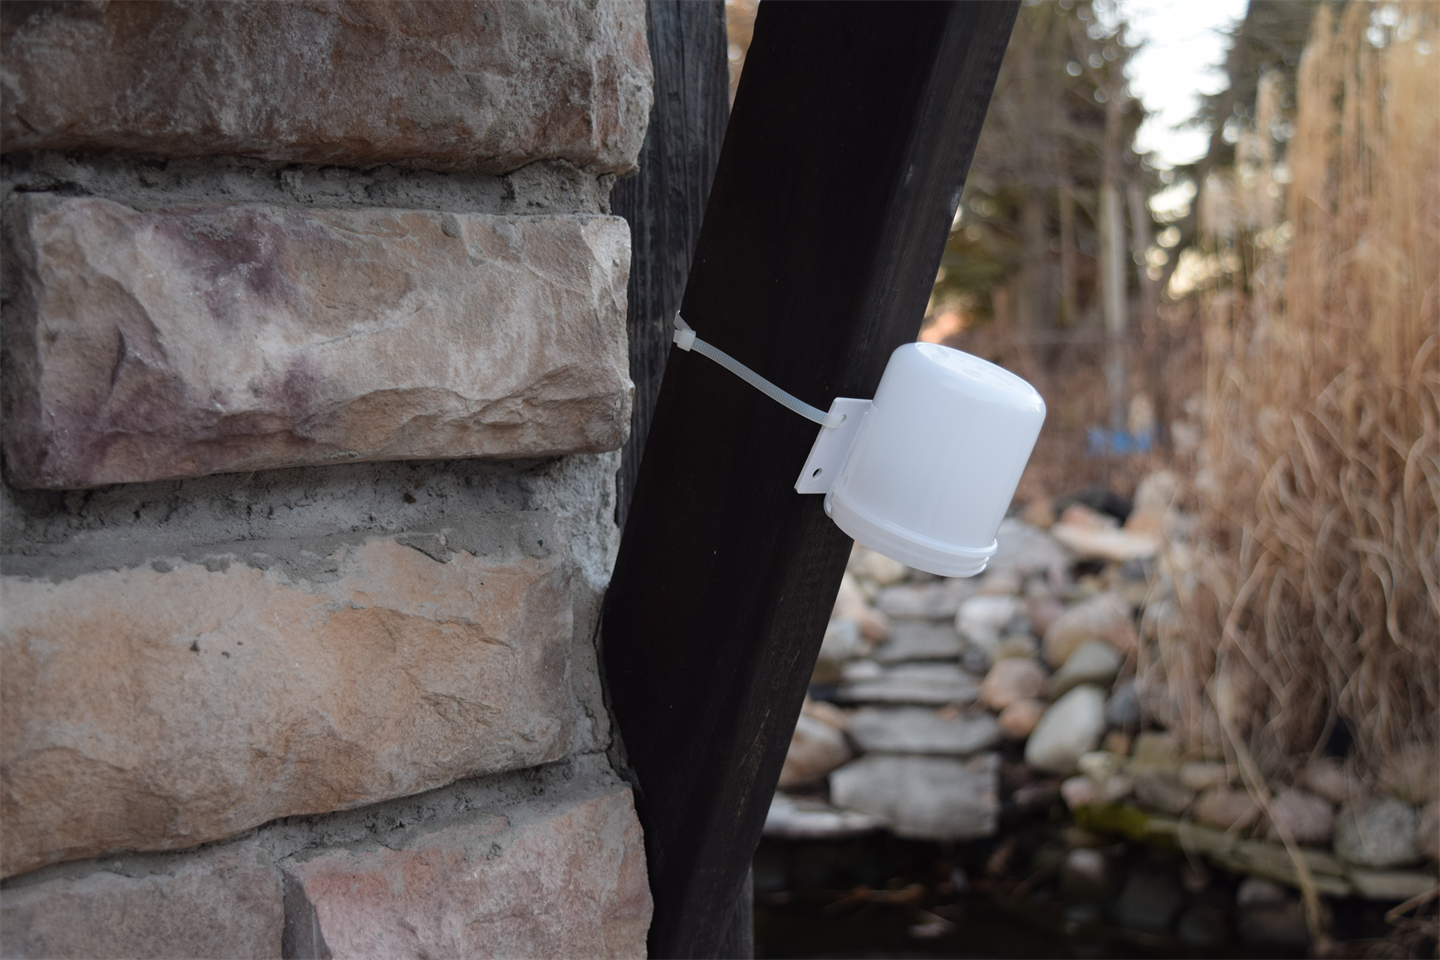
Protocol for NO-N0x, N02, S02 (PDF 497 KB)
NO, NO2, NO and SO Sampling Protocol x 2 Patented NO, NO2, NOx and SO2Sampling Protocol Using The Ogawa Sampler* Ogawa & Company, USA, Inc. 1230 S. E. 7th Avenue, Pompano Beach, Florida 33060, USA Tel: (954) 781-6223 Fax: (954) 781-6224 email: dschaeff@ogawausa.com Ogawa & Co., Ltd 3-2-15, Nakamachi-dori, Chuo-ku, Kobe 650, Japan Tel: (798) 33-6485 Fax: (798) 36-4848 email: hirogawa@kh.rim.or.jp V6.06 Ogawa & Co., USA, Inc. 1 NO, NO2, NOx and SO2 Sampling Protocol Notice Certain products mentioned in this User’s Guide may be trademarks. These products have been mentioned for identification purposes only. Version Number Edition Month / Year 6.0 June / 2006 * Acknowledgement System developed by Yokohama City Research Institute of Environmental Science, Yokohama, Japan, Report No. 128, March 1997 2 Ogawa & Co., USA, Inc. NO, NO2, NOx and SO2 Sampling Protocol Table of Contents GENERAL INFORMATION............................................................................................................. 4 OGAWA SAMPLER ASSEMBLY................................................................................................... 5 TRANSPORT AND STORAGE ...................................................................................................... 6 APPLICATION OF THE SAMPLER IN AN OUTDOOR MICROENVIRONMENT......................... 7 ANALYTICAL METHOD FOR NO, NO2 AND NOX....................................................................... 8 CALCULATION OF CONCENTRATION FOR NOX, NO2 AND NO ............................................ 11 CALCULATION OF CONCENTRATION CONVERSION COEFFICIENTS FOR NO AND NO2. 16 ANALYTICAL METHOD FOR SO2............................................................................................... 22 CALCULATION OF CONCENTRATION FOR SO2..................................................................... 23 COMPARISON OF INTEGRATED SAMPLING AND REAL-TIME MONITORS......................... 26 BLANK TEST VALUES ................................................................................................................ 27 EXAMPLE CALCULATIONS........................................................................................................ 28 Ogawa & Co., USA, Inc. 3 NO, NO2, NOx and SO2 Sampling Protocol General Information 1. "Water", in all cases, shall mean water meeting ASTM Type I specifications. (Equal to Milli-Q by Millipore). Use Reagent grade chemicals for all applications. 2. "Wash", in all cases, shall mean cleaning thoroughly with water meeting ASTM Type I specifications. 3. All sampler components should be carefully rinsed and dried before each use. This is an important function, and special care should be taken to do this step carefully. 4. Washing, drying, assembly of sampler, and loading with the proper pre-coated filters should be done in a clean area, free of NOx contamination. It is not necessary to use a glove box. 5. Ideal exposure time is at least 24 hours for monitoring NO, NO2 and NOx. For SO2 monitoring, the exposure time should be at least several days. This amount of time will develop results from a few PPB to large quantities of PPB's. Shorter exposure times are practical where the expected concentration is known to be high. It is possible to use an exposure time as long as 30 days for low concentrations of NO2 and SO2 . 6. When the point of research is outdoors, the sampler should be given protection from the sun and rainfall. Ogawa & Co., USA, Inc. has an opaque shelter and mounting bracket designed for this purpose. 7. Direct exposure of individuals can be easily measured by using the alligator clip to attach the sampler to clothing as close to the face as possible. 8. Concentration conversion coefficients for NO is 60, NO2 is 56 and SO2 is 39, assuming temperature of 20 ºC, and relative humidity of 70%. Other concentration conversion coefficients, based on different temperatures and humidity, can be obtained from Tables 4 and 6. 9. Satisfactory results have been obtained with concentrations as low as 2 PPB. 4 Ogawa & Co., USA, Inc. NO, NO2, NOx and SO2 Sampling Protocol Ogawa Sampler Assembly The sampler is comprised of 2 chambers. In each chamber of the sampler, the assembly stack-up is described below. Start at the innermost position with the pad and progress outwards to the diffuser end cap. 1 Solid Pad 2 Pad Reta ining Ring 3 S tain less Screen 4 Coa ted Coll ecti on Fi lter 5 S tain less Screen 6 D iffu ser End Cap Ogawa & Co., USA, Inc. 5 NO, NO2, NOx and SO2 Sampling Protocol Transport and Storage After assembly, the loaded sampler is placed into the re-sealable plastic bag, then the bagged sampler is placed into the brown airtight container, provided, and taken to the exposure site. After exposure, the above procedure is again followed to safely seal the used sampler into the brown airtight vial. It is then taken to the laboratory for analysis. Exposed pads to be analyzed at an off-site laboratory can be safely shipped in the PS-118 8 ml vial. These vials can be rinsed, dried, and reused many times. The sampler has the following lifetime associated with the various components Refrigerated Storage Method Frozen Storage Method Sealed in original glass vial within the aluminum pouch 90 days 1 year Resealed in vial, after opening 90 days Loaded sampler in bag placed in brown vial with lid 60 days Exposed loaded sampler, in bag placed in brown vial with lid* *Analysis should be done as soon as possible after exposure. 14-21 days Extracted solution in water, in sealed 8 ml vial 90 days Table 1: Shelf life associated with Passive Sampler Components 6 Ogawa & Co., USA, Inc. NO, NO2, NOx and SO2 Sampling Protocol Application of the Sampler in an Outdoor Microenvironment It is mandatory to protect the loaded sampler from moisture while it is being exposed. To accomplish this task, and still retain proper airflow to the device, it is necessary to use P/N PS-115 Opaque Shelter w/sampler bracket for NO-NOx, NO2, and SO2. O3 requires P/N PS-106 w/sampler bracket and stainless steel mounting band clamp. The PS-115 mounting bracket is attached to the site using several small screws or by passing a wire through two holes on each side of the bracket and then around the pole or post. The sampler easily clips on to the bracket and the cup slides over the bracket to protect the sampler. The PS-106 sampler bracket, once the sampler is clipped to it, easily slips over the shelter to hold the sampler in the correct position within the shelter. Ogawa & Co., USA, Inc. 7 NO, NO2, NOx and SO2 Sampling Protocol Analytical Method for NO, NO2 and NOx While preparing the reagents always use reagent grade chemicals, or highest grade available. For the analysis of NO, NO2, and NOx you will need the following reagents: Sulfanilamide Solution The sulfanilamide solution is prepared by dissolving 80 g of reagent grade sulfanilamide in a mixture of 200 ml concentrated phosphoric acid and 700 ml water. This solution is then diluted with water to make a total of 1000 ml. NEDA Solution The NEDA solution is prepared by dissolving 0.56 g N-(1-Naphthyl)-ethylenediamine dihydrochloride into 100 ml water. Store in a refrigerator. Color Producing Reagent Prepare color-producing reagent immediately before use. Mix the sulfanilamide solution and the NEDA solution in a 10:1 ratio. (10 parts Sulfanilamide solution to 1 part NEDA solution). Nitrite Standard Stock Solution Dry Sodium Nitrite, for over 4 hours, at a temperature of 105-110 ºC. Dissolve 1.5 g of this dried Sodium Nitrite in 1-liter water. A 1 ml sample of this solution contains 1000µg of Nitrite. Nitrite Working Standard Solution Dilute the Nitrite standard stock solution by 100 times with water. Then, 0, 2, 4,6,8, and 10 ml samples are each diluted with water to make 100 ml solutions. This produces working standard solutions of 0 - 1.0 µg nitrite/ml. Analytical Operation Samples After exposure to the test environment, the stainless screens and cellulose fiber filter are put into a 25 ml glass vial, containing 8ml water, and then shake immediately. Use separate glass vials for NO2 and NOx elements. Vials should be sealed, per accepted laboratory practice. Over the next 30 minutes, occasional shaking of the vials is recommended. 8 Ogawa & Co., USA, Inc. NO, NO2, NOx and SO2 Sampling Protocol At the end of the first 30 minute period, vials are cooled to 2-6 ºC, and 2 ml of color producing reagent are added. Shake quickly, after adding the color-producing reagent, and continue to keep vials cool for an additional 30 minutes. Vials are then allowed to equilibrate at room temperature, for about 20 minutes, and the amount of colored derivative is determined with a spectrophotometer at a wavelength of 545 nm. Unexposed elements are put through the same procedure to obtain a blank value determination. Standard Solutions From the previously prepared nitrite working standard solutions, (those containing 0 - 1.0 µg nitrite/ml), mix 8 ml of each of the nitrite working standards with 2 ml of color reagent, shaking immediately, to prepare a standard curve. Chill standard solution, like samples, before adding color reagent. Supplement It is strongly recommended that separate pipettes be used for nitrite standard stock solution from those used for preparing nitrite working standard solutions. When the exposed NOx element is placed in a vial with 8 ml of water, nitrite ion is produced. When 2 ml of the color-producing reagent is added, and the reaction is allowed to take place at 2-6 ºC, the amount of colored derivative produced is proportional to the amount of original nitrite. If the reaction takes place at warmer temperatures the amount of color derivative produced is not consistent. It is recommended to use at least 3 blanks for each lot analyzed. Procedures that help secure accurate analysis results include: 1. Screens and/or filter pads should be added to vials already containing a solution, never into a dry vial. 2. Vials must be shaken immediately after adding color reagent. 3. Cooling must be done according to the protocol. Ogawa & Co., USA, Inc. 9 NO, NO2, NOx and SO2 Sampling Protocol Flow Injection Method The flow injection method is a method using analyzing equipment available through various equipment manufacturers This new method is very useful where the analysis of large numbers of samples is required. It is a very simple and accurate method, minimizing deviations caused by elapsed time, temperature, and other variables. The results, using this method, have high precision. 10 Ogawa & Co., USA, Inc. NO, NO2, NOx and SO2 Sampling Protocol Ogawa & Co., USA, Inc. 11 Sx2S x y y( )- 0Calculation of Concentration for NOx, NO2 and NO In order to do the calculation you need to do the following steps: 1. Preparing the Standard Curve 2. Calculation of Concentration Data Preparing the Standard Curve In this procedure we will establish the Slope of the standard curve. You will need access to a spectrometer or a colorimeter and you will measure the absorbance of 6 standard samples. 2. Make sure that you have access to six standard samples. Make sure that the standard samples are of 0, 0.1, 0.2, 0.4, 0.6 and 0.8 µg/ml NO2 solutions. 8. The next row represents the product between the concentration and the absorbance. Fill in the values of x (y - yo). 4. The second column requires the calculation of x2. Enter the values if they do not exist on the table. 3. The first column requires the concentration of the standard sample (x). Enter the values if they do not exist on the table. 5. Compute (sum of all x2) and enter the value in cell (8). 9. Compute and enter the sum in cell (9). 7. Cell (2) represents the blank absorbance y0 (i.e. absorbance when the concentration is 0.0 µg/ml). Using this value calculate ( y - y0 ) and enter the net absorbance A for the various standard samples. 6. Using your colorimeter or spectrometer to measure the absorbance (y) of each sample. Enter the corresponding values in cell (2) through (7). 10. Compute the Slope by calculating 1. Refer to Table 2 on the following page. The first two columns refer to values related to the concentration of the standard NO2 solution. The next three columns refer to values related to the absorbance. The last column refers to the calculation of the Slope of the standard curve. Begin at the top left and proceed by filling in values in the different cells. Those cells which have been “grayed out” do not require a numerical value. When you finally enter a value at the bottom right cell you have completed the computation procedure. SSx y yx( )- 02 (cell (9) divided by (8) and enter the value in cell G. x and SO2 Sampling Protocol Ogawa & Co., USA, Inc. Concentration of Standard NO2 Solution (µg/ml) Absorbance Slope x x2 y y - y0 x ( y - y0 ) SSx y yx( )- 02 (1) (1) x (1) A (1) x A (9) / (8) 0 0 (2) 0.1 0.01 (3) (3) – (2) 0.2 0.04 (4) (4) – (2) 0.4 0.16 (5) (5) – (2) 0.6 0.36 (6) (6) – (2) 0.8 0.64 (7) (7) – (2) Sx2 S x y y( )- 0 (9) / (8) (8) 1.21 (9) G Table 2: Preparing the Standard Curve for NO, NO2 and NOx NO, NO2, NO 12 NO, NO2, NOx and SO2 Sampling Protocol CALCULATION OF CONCENTRATION DATA After the Slope for the standard curve has been prepared, you will calculate the concentration. You will need access to a spectrometer or a colorimeter and you will measure the absorbance of the sample that you have collected. Here are the steps: 1. Refer to Table 3 on the following page. Each calculation has to be repeated several times depending upon the samples which you have. 2. Enter the location (descriptive term) for each site. 3. Enter the exposure time associated with each site. Enter values in row (3). NOx Calculation 4. Using your spectrometer or colorimeter measure the absorbance for the sample associated with each site. Enter the values in row (4). 5. Measure the absorbance associated with a blank sample (0 µg/ml). Enter the values in row (1). 6. Calculate the absorbance for each sample. Enter the values in row (5) by taking the difference between rows (4) and (1). 7. Calculate the solution concentration in row 4. This is done by taking the absorbance in row (5) and dividing it by G – the Slope of the standard curve. Note, G was computed previously using Table 2 . 8. Calculate the collected weight in ng and enter the value in row (7). This value is obtained by taking a product of the solution concentration (6) and the abstract amount (usually 8 ml) and a factor of 1000 (for converting from PPM to PPB). NO2 Calculation 9. Using your spectrometer or colorimeter measure the absorbance for the sample associated with each site. Enter the values in row (9). 10. Measure the absorbance associated with a blank sample (0 µg/ml). Enter the values in row (2). 11. Calculate the absorbance for each sample. Enter the values in row (10) by taking the difference between rows (9) and (2). Ogawa & Co., USA, Inc. 13 NO, NO2, NO 14 x and SO2 Sampling Protocol Ogawa & Co., USA, Inc. 12. Calculate the solution concentration in row (11). This is done by taking the absorbance in row (10) and dividing it by G – the Slope of the standard curve. Note, G was computed previously using Table 2. 13. Calculate the collected weight in ng and enter the value in row (12). This value is obtained by taking a product of the solution concentration (11) and the abstract amount (usually 8 ml) and a factor of 1000 (for converting from PPM to PPB). 14. Next calculate the concentration in row (13). This value is obtained by multiplying the concentration conversion coefficient aNO2 by the collected weight (12) and dividing by the exposure time (3). At 20ºC and 70% relative humidity aNO2 = 56. For other values of temperature and relative humidity please refer to the following section for calculation of aNO2 . NO Calculation 15. Calculate the collected weight in ng and enter the value in row (14). This value is obtained by taking a difference of the NOx weight (7) and the NO2 weight (12). 16. Next calculate the concentration in row (13). This value is obtained by multiplying the concentration conversion coefficient aNO by the collected weight (12) and dividing by the exposure time (3). At 20ºC and 70% relative humidity aNO = 60. For other values of temperature and relative humidity please refer to the following section for calculation of aNO . NOx Calculation 17. Calculate the concentration of NOx in row (8) by adding the concentration of NO2 (13) and NO (15). NO, NO2, NOx and SO2 Sampling Protocol a & Co., USA, Inc. 15 Compound Blank Absorbance B1 B2 B3 Average Slope of the Standard Curve Temperature ºC Relative Humidity (%) Concentration Conversion Coefficient aNO2 aNO NOx (1)= G = (20ºC) (70%) aNO2 = (56) aNO = (60) NO2 (2)= aNO2 = aNO = • aNO2 = 56 and aNO = 60 when Temperature = 20ºC and Relative Humidity = 70%. For other combinations of temperature and relative humidity please refer to the discussion provided in following section. Specification Samples Sample Number 1 2 3 4 Sample Location Sampling Time (min) (3) =(3) Sample Absorbance (4) =(4) NOx Absorbance (5) = (4) – (1) Solution Concentration (µg/ml) (6) = (5) / G Collected Weight (ng) (7) = (6) x 8 x 1000 Concentration (PPB) (8) = (13) + (15) Sample Absorbance (9) = (9) NO2 Absorbance (10) = (9) – (2) Solution Concentration (µg/ml) (11) = (10) / G Collected Weight (ng) (12) = (11) x 8 x 1000 Concentration (PPB) (13) = aNO2 x (12) / (3) NO Collected Weight (ng) (14) = (7) – (12) Concentration (PPB) (15) = aNO x (14) / (3) Table 3: Calculation of Concentration Data For NOx , NO2 and NO OgawNO, NO2, NOx and SO2 Sampling Protocol Calculation of Concentration Conversion Coefficients for NO and NO2 Typical values of aNO and aNO2 are provided in Table 4. For a combination of temperature and relative humidity which does not exist in Table 4 you can calculate aNO and aNO2 using the following formulas: 8.89)]T[x009.2()]RH[x]P[x677.0(10000220)]RH[x]P[x78.0(10000)valuestypicalfor5Tablesee(PPP2]P[)valuestypicalfor5Tablesee(]T[etemperaturambienttheatwaterofpressureVaporPdegC) 20at Hgmm in pressureor (water vap 535 17.P%inhumiditylativeRe]RH[CentigradedegreeinetemperaturAmbient]T[2NONO3/2NTNT N++=a+-=a??????+===== 16 Ogawa & Co., USA, Inc. NO, NO2, NOx and SO2 Sampling Protocol Example Calculation for aNO and aNO2 Let us calculate aNO and aNO2 at 9 °C and 60% Relative Humidity. Looking at Table 4 we have aNO = 61 and aNO2 = 64. Let us now use the formulas provided earlier: 58.638.89)9x009.2()60x216.1x677.0(100008.89)]T[x009.2()]RH[x]P[x677.0(1000032.61220)60x216.1x78.0(10000220)]RH[x]P[x78.0(10000)5Tablesee(216.1535.17609.8535.17x2PPP2]P[)5Tablesee(609.8P535.17P60]RH[9]T[2NONO3/23/2NTNTN=++=++=a=+-=+-=a=??????+=??????+===== Ogawa & Co., USA, Inc. 17 NO, NO2, NOx and SO2 Sampling Protocol Temperature (ºC) Relative Humidity(%) aNO2 aNO-10 50 84 61 -9 50 83 61 -8 50 81 61 -7 50 80 61 -6 50 79 61 -5 50 78 61 -4 50 77 61 -3 50 76 60 -2 50 75 60 -1 50 74 60 0 50 74 60 1 60 68 64 2 60 68 63 3 60 67 63 4 60 66 63 5 60 66 63 6 60 65 62 7 60 65 62 8 60 64 62 9 60 64 61 10 60 63 61 11 60 63 61 12 60 62 60 13 60 62 60 14 60 61 60 15 70 58 63 16 70 58 62 17 70 57 62 18 70 57 61 19 70 57 61 20 70 56 60 Table 4: aNO and aNO2 as a function of temperature and relative humidity … Table continued on next page 18 Ogawa & Co., USA, Inc. NO, NO2, NOx and SO2 Sampling Protocol Temperature (ºC) Relative Humidity(%) aNO2 aNO21 70 56 60 22 70 56 60 23 70 55 59 24 70 55 59 25 80 53 61 26 80 52 61 27 80 52 60 28 80 52 60 29 80 52 59 30 80 52 59 31 80 52 58 32 80 51 58 33 80 51 57 34 80 51 57 35 80 50 57 36 80 50 56 37 80 50 56 38 80 50 56 39 80 49 55 40 80 49 55 Table 4: aNO and aNO2 as a function of temperature and relative humidity Ogawa & Co., USA, Inc. 19 NO, NO2, NOx and SO2 Sampling Protocol Temperature Water Vapor Pressure Vapor Pressure Coefficient [T] [PT] [P] degC mmHg dimensionless -10 2.149 1.4697 -9 2.326 1.4609 -8 2.514 1.4518 -7 2.715 1.4421 -6 2.931 1.4320 -5 3.163 1.4213 -4 3.410 1.4101 -3 3.673 1.3984 -2 3.956 1.3861 -1 4.258 1.3732 0 4.579 1.3599 1 4.926 1.3459 2 5.294 1.3314 3 5.685 1.3164 4 6.101 1.3009 5 6.543 1.2849 6 7.013 1.2685 7 7.513 1.2515 8 8.045 1.2341 9 8.609 1.2163 10 9.209 1.1980 11 9.844 1.1794 12 10.518 1.1605 13 11.231 1.1412 14 11.987 1.1217 15 12.788 1.1018 Table 5: Water Vapor Coefficients as a function of Temperature …Table continued on next page 20 Ogawa & Co., USA, Inc. NO, NO2, NOx and SO2 Sampling Protocol Temperature Water Vapor Pressure Vapor Pressure Coefficient [T] [PT] [P] degC mmHg dimensionless 16 13.634 1.0818 17 14.530 1.0615 18 15.477 1.0411 19 16.477 1.0206 20 17.535 1.0000 21 18.650 0.9794 22 19.827 0.9587 23 21.068 0.9380 24 22.377 0.9174 25 23.756 0.8969 26 25.209 0.8764 27 26.739 0.8561 28 28.349 0.8360 29 30.043 0.8160 30 31.824 0.7962 31 33.695 0.7767 32 35.663 0.7575 33 37.729 0.7385 34 39.898 0.7198 35 42.175 0.7013 36 44.563 0.6832 37 47.067 0.6655 38 49.692 0.6480 39 52.442 0.6309 40 55.324 0.6142 Table 5: Water Vapor Coefficients as a function of Temperature Ogawa & Co., USA, Inc. 21 NO, NO2, NOx and SO2 Sampling Protocol Analytical Method for SO2 Sample (One exposed filter pad only) After exposure to the test environment, the stainless screens and cellulose fiber filter are put into a 25 ml glass vial, containing 8ml water, and then shake immediately. Vials should be stoppered, per accepted laboratory practice. Over the next 30 minutes, occasional shaking of the vials is recommended. Add 0.2 ml of Hydrogen Peroxide solution (1.75% solution), and shake slowly for 10 minutes. Vials are then allowed to equilibrate at room temperature, for about 20 minutes, then sent for IC analysis Unexposed elements are put through the same procedure to obtain a blank value determination. Analysis by Ion Chromatograph Analyzer Dionex Ion Chromatograph 4000i Columns AS4A Separation Columns Flow Rate 1.7 ml/min Detector Range 30 µs, 10 µs, 1 µs Eluant 1.8 mM Na2CO3 + 1.7 mM NaHCO3Regenerant 0.25 N H2SO4Sample Loop 100 µl 22 Ogawa & Co., USA, Inc. NO, NO2, NOx and SO2 Sampling Protocol Calculation of Concentration for SO2 SO2 concentration (ppb) = tWSOx 2SO2a where : WSO2 is the sulfate quantity (in ng) collected on the SO2 elements, determined using the standard curve. aSO2 is the ppb concentration conversion coefficients (ppb - min/ng). At 20 °C the value of aSO2 = 39. t is sample collection time in minutes If you have sample conditions other than 20 °C please refer to Table 6 which provides aSO2 at various commonly encountered values. Ogawa & Co., USA, Inc. 23 NO, NO2, NOx and SO2 Sampling Protocol Temperature Diffusion Coefficient Ratio of Diffusion Coefficients Conversion Coefficient T DT D20/DT aSO2ºC cm2/sec dimensionless PPB-min/ng -10 0.1068 1.22 47.5 -9 0.1076 1.21 47.2 -8 0.1083 1.20 46.9 -7 0.1091 1.19 46.5 -6 0.1098 1.19 46.2 -5 0.1106 1.18 45.9 -4 0.1113 1.17 45.6 -3 0.1121 1.16 45.3 -2 0.1129 1.15 45.0 -1 0.1136 1.15 44.7 0 0.1144 1.14 44.4 1 0.1151 1.13 44.1 2 0.1159 1.12 43.8 3 0.1167 1.12 43.5 4 0.1175 1.11 43.2 5 0.1182 1.10 43.0 6 0.1190 1.09 42.7 7 0.1198 1.09 42.4 8 0.1206 1.08 42.1 9 0.1214 1.07 41.8 10 0.1222 1.07 41.5 11 0.1230 1.06 41.3 12 0.1237 1.05 41.0 13 0.1245 1.05 40.8 14 0.1253 1.04 40.5 Table 6: Conversion Coefficient aSO2 for SO2 as a function of Temperature …Table continued on next page 24 Ogawa & Co., USA, Inc. NO, NO2, NOx and SO2 Sampling Protocol Temperature Diffusion Coefficient Ratio of Diffusion Coefficients Conversion Coefficient T DT D20/DT aSO2ºC cm2/sec dimensionless PPB-min/ng 15 0.1261 1.03 40.3 16 0.1269 1.03 40.0 17 0.1277 1.02 39.8 18 0.1286 1.01 39.5 19 0.1294 1.01 39.2 20 0.1302 1.00 39.0 21 0.1310 0.99 38.8 22 0.1318 0.99 38.5 23 0.1326 0.98 38.3 24 0.1334 0.98 38.1 25 0.1343 0.97 37.8 26 0.1351 0.96 37.6 27 0.1359 0.96 37.4 28 0.1367 0.95 37.1 29 0.1376 0.95 36.9 30 0.1384 0.94 36.7 31 0.1392 0.94 36.5 32 0.1401 0.93 36.2 33 0.1409 0.92 36.0 34 0.1418 0.92 35.8 35 0.1426 0.91 35.6 36 0.1435 0.91 35.4 37 0.1443 0.90 35.2 38 0.1452 0.90 35.0 39 0.1460 0.89 34.8 40 0.1469 0.89 34.6 Table 6: Conversion Coefficient aSO2 for SO2 as a function of Temperature Ogawa & Co., USA, Inc. 25 NO, NO2, NOx and SO2 Sampling Protocol Comparison of Integrated Sampling and Real-Time Monitors NO Ogawa Passive Sampler (PPB)Continuous Real-Time Monitor (PPB) NO2 Ogawa Passive Sampler (PPB)Continuous Real-Time Monitor (PPB) SO2 Ogawa Passive Sampler (PPB)Continuous Real-Time Monitor (PPB) Reference: Yokohama City Research Institute of Environmental Science, Yokohama, Japan, Report No. 128, March 1997 26 Ogawa & Co., USA, Inc. NO, NO2, NOx and SO2 Sampling Protocol Blank Test Values Below is the obtained absorbance for 3 unexposed filters coated for NO2 and NOx. NO2 Absorbance NOx Absorbance 0.009 0.155 0.009 0.142 0.008 0.149 0.009 0.149 Average 0.009 Average 0.149 The higher blank test for NOx compared to that of NO2 is due to PTIO also reacting when color producing is being done. This makes the produced material absorbing wavelength stay near the determining wave length. But, as the NOx collection element holds a fixed quantity of 1.5mg PTIO, the blank value will be stable if the analytical operation is done in a short time. Blank values can also be made lower by taking away PTIO blue color, by extracting with ethyl ether. Ogawa & Co., USA, Inc. 27 NO, NO2, NOx and SO2 Sampling Protocol Example Calculations Exposure was made in the ambient air at roadside for 1432 minutes, from 10:32 hrs. August 4th to 10:24 hrs. August 5th. The samplers determined NOx at 0.343 and NO2 at 0.094. The collected NOx quantity is determined as follows: WNOx = SABNOx – BABNOx x V S Where: WNOx is in ug of nitrite. SABNOx is absorbance of NOx sample. BABNOx is absorbance of NOx blank. S= Slope (for this calculation assume it is 0.8415) V= volume of extract in ml. = 0.343-0.149 (8) = 1.844 ug nitrite = 1844 ng nitrite. .8415 Collected NO2 Quantity Is Converted to NO2 Quantity as follows: WNO2 = SABNO2 – BABNO2 x V S Where: WNO2 is in ug of nitrite. SABNO2 is absorbance of NO2 sample. BABNO2 is absorbance of NO2 blank. S= Slope (for this calculation assume it is 0.8415) V= Volume of extract in ml. = 0.094-.009 (8) = 0.808 ug nitrite = 808 ng nitrite .8415 From the WNOx and WNO2 values, using equation (5) we can calculate the PPB of NO in the air sample: NO (PPB)= a NO (WNOx-WNO2) / t = 60 (1844-808) / 1432 = 43 PPB Using equation (6) we can calculate the PPB of NO2: NO2(PPB)= a NO2 (WNO2) / t = 56 (808) / 1432 = 32 PPB Since the NOx concentration is the sum of the NOx and NO2: NOx (PPB) = 43 + 32 = 75 PPB 28 Ogawa & Co., USA, Inc. Ogawa & Co., Ltd Notice Version Number Edition * Acknowledgement Table of Contents General Information Ogawa Sampler Assembly Transport and Storage Application of the Sampler in an Outdoor Microenvironment Analytical Method for NO, NO2 and NOx While preparing the reagents always use reagent grade chemic Analytical Operation Calculation of Concentration for NOx, NO2 and NO Calculation of Concentration Conversion Coefficients for NO Analytical Method for SO2 Calculation of Concentration for SO2 Comparison of Integrated Sampling and Real-Time Monitors Blank Test Values Example Calculations
Most popular related searches