

xarvio™ – Digital Farming Solutions
Field Monitor
Receive, upload & analyze all field-zone specific information in one place. Increase transparency & take better informed decision for your fields, all year long. Set-up field management zones; for example, buffer & biodiversity zones, trial plots or field obstacles; according to your farm’s needs.
Most popular related searches
field monitoring
weather data
satellite data
field data
soil mapping
climate database
satellite image
risk modeling
weather station
weather forecasting
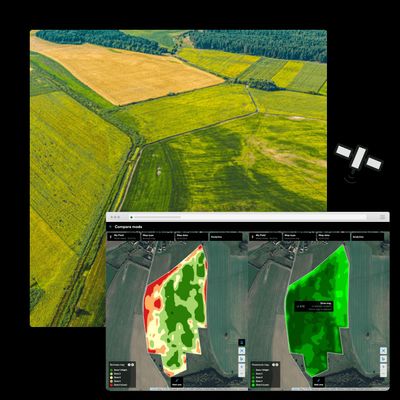
Current Biomass Maps and Satellite Images
Identify high & low performing field-zones based on current satellite data
- NEW - Absolute biomass…most maps on the market are relative for each field in a given moment in time, with absolute biomass you can compare different fields directly…also with previous years.
- Use the current biomass maps to make better-informed nutrition, irrigation, crop protection and growth regulator decisions.
- Get short-term feedback on the success of your field management activities.
- Identify issues in your fields early on to prioritize your scouting activities.
Historical yield potential maps
Identify high & low performing field-zones based on up to 15 years of historic satellite data
- Before Season: Use the historical biomass map to plan your seeding and field preparations
- In-Season: Guaranteed availability of variable application maps based on historic field-zone performance, independently of in-season cloud coverage
Management zones
Set-up field management zones according to your farm’s needs, permanently or season specific.
- Identify the right place for management zones by seeing different information layers in the background, e.g.
- Historic & current biomass
- Soil maps
- Yield maps
- Categorize them and manage them accordingly
- Buffer & biodiversity zones, e.g. bird windows
- Trial plots
- Field obstacles
- Upload or send the management zone maps to your terminal for automatic on-field implementation
One central hub to document, visualize & analyze your field management activities and see the resulting in-season zone specific biomass development right next to it.
- Monitor and measure the impact of your agronomic decisions on crop performance throughout and across seasons.
- Achieve higher yields by comparing the results of different field management strategies on your fields.
Detailed in season weather analysis, hourly weather forecasts & access to the historic climatic database.
- Know exactly when the best conditions are for your field management activities, considering temperature, rain, wind and sunshine forecasts.
- Compare rainfall & temperatures of the current season with the average of the last 10 years.
Get more precise weather data & field analysis
- Engage with user friendly visualizations of your in-field weather data
- Receive regular, real-time updates directly from your fields
- Compare this season’s rainfall and temperature on your fields with historical climatic conditions
- Seamlessly feed in-field data into xarvio’s agronomic risk models for even better recommendations