

- Home
- Companies
- Pasco Scientific
- Products
- Pasco - Model SE-3607 - UV-Vis ...
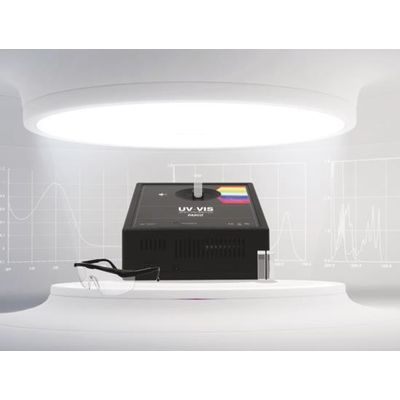
Pasco - Model SE-3607 -UV-Vis Spectrometer
The SE-3607 is an easy-to-use, wide range UV-Vis spectrometer that delivers fast, accurate and reliable performance for routine analyses in chemistry and biochemistry teaching labs. With USB connectivity and cross-platform Spectrometry Software, the PASCO UV-Vis Spectrometer improves collaboration between lab members, enabling data collected on a computer or laptop to be analyzed on tablets, iPads, and Chromebooks*. Additional accessories, such as the UV-Vis Fiber Optic Kit, can be used to extend the spectrometer’s capabilities for the analysis of emission spectra, light sources, and the classification of lasers. * Chromebooks are not compatible with the PASCO UV-Vis Spectrometer for data collection (analysis only).
Highly accurate spectrometer with broad range, ultraviolet through visible light illumination for detailed spectroscopic techniques in chemical structure and concentration determination.
- 1x Semi-Microvolume Cuvettes (Qty. 10)
- 1x Cuvette Rack
- 1x USB-A to USB-B Cable
- 1x External AC Adapter, 24 V Power Supply
- 1x Foam Lined Carrying Case (ABS)
- Spectral scans from 180 to 1050 nm
- Intuitive, software-based operation
- Built-in tools for routine analyses
- One-click light and dark calibrations
- Clear marking to indicate proper cuvette positioning
The PASCO UV-Vis Spectrometer is durably designed to deliver top performance in fast-paced teaching labs.
- Compact, space-saving design
- High-sensitivity CMOS detector for faster analysis
- Internal drain reduces the risk of damage from drips and spills
- Isolated optic bench guarantees consistent accuracy over time (±1 nm)
- USB connectivity supports use with laboratory and student devices
- Compatible with a wide range of square and round cuvettes of 1-cm pathlengths
With wide range detection across the Visible, UVA, UVB, and UVC regions, the PASCO UV-Vis Spectrometer provides an exceptional standalone solution for routine applications such as:
- Kinetic measurements
- Purified protein analysis
- Determination of equilibrium constant
- Nucleic acid purity testing
- Quantification of DNA and RNA
- Analysis of extracted or synthesized compounds
- Determination of nucleic acid concentrations
- Colorimetric assays for protein quantification (e.g., Bradford, BCA, Lowry)
- Spectrophotometric determination of chemical and biochemical compounds
The PASCO UV-Vis Spectrometer is fully integrated with our user-friendly Spectrometry Software.
This free software is compatible with most student devices, enabling lab groups to quickly share and review their data with ease. Also available as a free, fully functional app, PASCO`s cross-platform Spectrometry Software improves the efficiency of analyses with features such as:
- Easy-to-use navigation
- One-click light and dark calibrations
- Automatic display and storage of sample data
- Onboard scan averaging and data smoothing
- Intuitive run renaming for improved data tracking
- Spectral graph correlates visible wavelengths with color
- Built-in Beer-Lambert law with linear fits for determining concentrations
- Print spectrum and results snapshots
- Export data as a .csv file or .png screenshot for further analysis in Excel, SPARKvue, or PASCO Capstone
PASCO’s free Spectrometry Software includes four preprogrammed displays:Analyze Solution: Wavelength vs. Absorbance
A sample of synthesized acetylsalicylic acid dissolved in ethanol was analyzed using the Analyze Solution screen. The sample`s absorption spectrum indicates that the sample absorbs strongly at 237 and 313 nm.
Concentration: Concentration vs. Absorbance (Beer`s Law)
The concentration of a purified protein was determined using the Beer-Lambert law within the Concentration screen. After selecting a target wavelength in the Analyze Solution screen, five protein standards (BSA) with known concentrations were analyzed. A linear fit was applied to create a standard curve, and the concentration of the unknown protein was determined to be 0.215 mmol/L.
Time: Time vs. Absorbance (Kinetics)
The fading of Phenolphthalein in NaOH was measured over time using the Time screen. The absorbance of the wavelength associated with Phenolphthalein was measured over time for samples with varying concentrations of NaOH. The results for a sample containing 0.3M NaOH and Phenolphthalein are provided below.
Analyze Light: Wavelength vs. Intensity
The Quartz Fiber Optic Cable Set was used to analyze the intensity of various spectral sources across the UV-Visible spectrum. The spectrum for Helium is shown below using the Analyze Light screen.
- Determination of solution concentrations
- Identification of unknown substances
- Measurement of reaction rates or rate of decay
- Colorimetric assays (e.g., BCA, Bradford, Lowry)
- Purity testing of synthesized compounds
- Determination of the equilibrium constant
- Determination of molar absorption coefficients
- Quality testing (e.g., fermentation mediums, food adulteration, QA levels)
- 1x Semi-Microvolume Cuvettes (Qty. 10)
- 1x Cuvette Rack (EC-3590)
- 1x USB-A to USB-B Cable
- 1x External AC Adapter, 24 V Power Supply
- 1x Foam Lined Carrying Case (ABS)
- Dimensions: 19.5 × 24.5 × 7.0 cm
- Light Source: Deuterium (UV) Tungsten (Vis)
- Detector: 2048 CMOS linear (0.3nm reporting interval)
- Wavelength Range: 180 – 1050 nm
- Grating: 500 lines/mm
- Signal to noise: 2000:1
- Optical Resolution: 1.5 nm
- Wavelength Accuracy: 1.0 nm
- Photometric Accuracy: ±5%
- Photometric Range (best accuracy): 0.1 – 1.0 (reports full range 0.0 to 3.0)
- Typical scan time (depends on integration): 4 ms – 10 s
- Connectivity: USB only
- Power consumption: 2.5 A startup 350 mA continuous
- Power Supply: 100 - 240 VAC to 24VDC @ 2.5A
- Warranty: 5 year limited on hardware, 1 year on lamps