

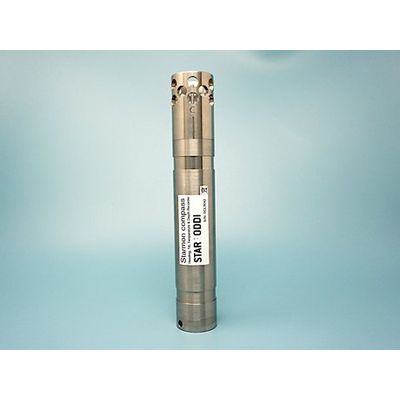
Starmon Compass, Rechargeable
- Compact with multiple sensors
- Long lasting rechargeable battery
- Fast response and large memory
- Vertical or horizontal placement
Compact with Multiple Sensors
Starmon Compass is a multi-sensor instrumentation with built-in sensors providing time-stamped measurements of compass heading, pitch & roll, 3-D tilt, acceleration, pressure, depth and temperature. The compact sized loggers dimensions are 236 mm length x 40 mm diameter. All measurements are recorded simultaneously at a user-defined interval.
Application
The Starmon Compass logger is a unique research tool for collecting data on heading direction (yaw) and tilt (pitch & roll) of gear in underwater environments, for both short and long-term deployments:
- Fishing gear studies, for gear behaviour analysis at different fishing depths
- Movements of underwater robots and unmanned vehicles (AUV, ROV)
- Monitoring yaw, pitch and roll of scientific instruments and frames during surveys at different depths, for study enhancement, currents and cable rotation monitoring
- Heading, pitch and roll of towed packages, hydrophone arrays and nets
- Oil and gas pipeline inspection, for example pig launching (pigging)
Long Lasting Replaceable Battery
Depending on interval setup, the rechargeable battery can last several years on a single charge. At an interval of 1 min it can last 2 years on a single charge. At 1 sec interval a single charge lasts 2 weeks. The logger can be fully recharged at least 500 times before having to replace the battery. The software has an energy and memory calculator.
Reliable and Accurate
This highly reliable and accurate instrument is able to record multiple parameters simultaneously. The heading accuracy is better than +/-5° and pitch and roll accuracy +/-2°, when within a tilt range of +/-45°. The depth/pressure sensor accuracy is +/-0.3% of the selected calibration range and temperature accuracy +/-0.025°C.
Fast Response and Large Memory
The logger has a fast response temperature probe with a time constant of 2 seconds. The memory capacity is 2.2 million measurements per sensor, all parameters recorded simultaneously. The measurements can be set to record as fast as every second. Battery consumption depends on the sampling interval used and frequency of use. The battery is rechargeable.
Vertical or Horizontal Placement
During interval setup of the logger the user selects if the logger will be placed horizontally or vertically. This gives more flexible mounting options. The housing has two slots for strapping the logger to the gear. For attaching to a flat surface, Star-Oddi offers a plastic plate holder. Detailed instructions on placement can be seen in a downloadable PDF under the Documentation tab.
Viewing Measurements in Real-Time
It is recommended to do an online test before placing the logger on gear. The software offers a real-time view of measurements while the logger is connected to a computer. This feature is especially helpful to learn about the functionality of the heading, pitch and roll sensors when placed in different directions and angles. Understanding how the sensors work helps to ensure a correct placement. When doing an online test the measurements can be viewed in real-time in a graph and table.
Shallow to Deep Ocean
The self-contained logger has a robust titanium housing that tolerates extreme conditions. Customers can choose from a range of depth sensor calibrations. Available depth ranges are: 0-50m, 100m, 200m, 500m, 1000m, 2000m, 4000m, or 4500m.
Full Ocean Depth Housing Available
For use at depths greater than 4000m a customized housing is available that tolerates any ocean depth. This ultra high-pressure resistant titanium housing comes without a pressure sensor, and is therefore equipped with compass, pitch & roll, 3-D tilt and temperature sensors.
Simple in Use, From Setup to Data Retrieval
The logger and the accompanying items are designed for ease of use throughout the research process, from setting up the recorder, attaching it, to retrieving and analysing the data.
The logger is supported by the SeaStar software for Windows and a standard USB cable which are purchased with the first order. With these two accessories the user can set up the logger for measurements and then retrieve the results.
Setting the Logger Up for Measurements
To launch the compass logger for measurements, the end cap of the housing is unscrewed and a USB cable connects directly from the logger to a computer. In the SeaStar software, the user selects either a horizontal or vertical placement of the logger, sets the start time, start date and sampling interval for launching the logger into measurement mode. The logger synchronizes its internal clock with the date and time on the computer used to set up the logger.
Placement of the Logger
The logger can be placed horizontally or vertically on the gear. Placement is defined in the software before launching the logger into measurement mode. The titanium housing has a reference line marked C. If placed horizontally this line faces directly up. If placed vertically this line should face the same direction as the gear moving forward. In these central positions the pitch and roll show around 0° and are optimal start-up positions for the accuracy of the compass heading.
The sensor probe end should face forward, aligned to the heading direction of the gear. If placing the logger vertically the sensor end faces down with the reference line facing forward to the heading direction of the gear
Single or Multiple Intervals
Shifting between different intervals within a measurement sequence is possible with the multiple intervals setup definition, enabling the user to have faster measurements during specific time periods. Energy consumption from the rechargeable battery depends on the sampling interval setup.
Memory and Battery Life Calculations
The software automatically calculates the battery consumption based on defined interval settings. This makes it easy for the user to decide on a suitable interval setup to fit the study. The date and time when memory fills is also displayed. For a chosen study length it is possible to have the software do memory and battery calculations.
Uploading the Data
After recovering the logger, it is connected via the USB cable to the computer and the recorded data is uploaded to the software. The results are displayed both in graphic and tabular form and the data can be exported in other formats such as CSV and Excel. The time-series data shows each measurement with its own time stamp. After data retrieval the logger can be recharged and restarted or put into sleep mode for later use.
Viewing Compass Heading Data
With default settings the heading (0-360°) is approximated to a 4 point compass but settings can be changed to 8 or 16 point compass. Besides the graph and table viewing it is also possible to get histogram view in the software.
Recharging the Battery
To charge the compass logger, the end cap of the housing is unscrewed and a USB cable connects directly from the recorder to a computer. The diode next to the logger‘s USB connector illuminates yellow upon connection. The logger is fully charged when the yellow light is off.
After data retrieval the logger can be restarted or disconnected for later use. Battery life estimation is reported upon connection with the logger but a full recharge is recommended before another deployment. Due to the low energy consumption circuitry design, the battery life is long. However, the energy capacity on a single charge depends on the sampling interval setup.