

- Home
- Companies
- Tekscan, Inc.
- Products
- Tekscan - Model I-Scan - Tactile ...
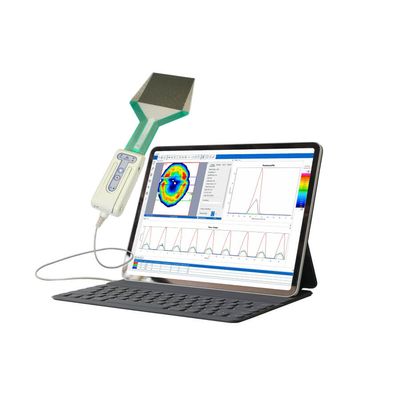
Tekscan - Model I-Scan -Tactile Pressure Mapping System
The versatile I-Scan tactile pressure mapping system is tailor-made by choosing from over 200 pressure sensors to meet your specific application requirements. I-Scan™ is a powerful tool that accurately measures and analyzes interface pressure between two surfaces, utilizing a thin and flexible sensor. The system is comprised of data acquisition electronics, sensors, and software. Measuring both force and pressure, the exceptionally thin tactile sensor provides minimal interference between the objects being measured, allowing the true interface pressure data to be obtained. The interface pressure data collected offers vital information and insight to enhance product design, manufacturing, quality, and research.
- Total force
- Pressure distribution
- Peak pressure
- Center of force
- Forces in different areas
- Test & measurement
- Research & development
- Design validation
- Machine set-up
- Quality control
I-Scan™ provides the tools for more comprehensive and higher quality analysis than ordinary pressure sensing technologies.The software displays the pressure distribution data, in multiple formats, for superior analysis.
Key Features
- Real-time sensor data viewing
- Visualization enhancements of the pressure image
- 2D & 3D representations
- Interpolation, contours & averaging for clearer image
- Pressure displayed in engineering or relative units
- Single & multi-point calibration
- Analysis tools
- Center of force & trajectory
- Peak force and contact area identifiers
- ASCII export capability
- Save as AVI
- Sensor scan rate up to 20 kHz
- Graphical analysis of real-time or stored data
- Total force
- Contact area
- Contact pressure
- Peak force
- Peak contact pressure
With the ability to capture force over time, users can click at any point of a pressure mapping recording to view the resulting pressure output image.
Data from each frame includes:
- Total force
- Center of force location
- Peak pressure
- Pressure distribution (e.g., force on each sensing element)
Each sensor requires its own unique MAP driver file for the software to function properly. By utilizing sensor MAPs, the software is able to provide an accurate depiction of each unique sensor layout. The sensor MAP controls the shape of the pressure image window in the software, which corresponds to the shape and dimensions of the sensing area on the sensor.
Visualization
I-Scan 9 offers optimized 2D and 3D display algorithms in the software to average sensor data into a smooth pressure map display; giving a more realistic representation of the object being measured.
Select among several averaging views, including combination views.
Property Table
I-Scan’s integrated property table displays key metrics of all regions placed on multiple data sets being analyzed simultaneously. Total Force, Contact Area, Contact Pressure, Peak Force and Peak Contact Pressure are displayed to allow for in depth comparison of multiple tests. Colors of region shapes can be customized to match names of rows for easy correlation.
Tablet Compatibility
I-Scan Evolution software can run from a tablet operating on Windows 7 and up. This feature makes your I-Scan system more portable and provides other capabilities, including:
- Remote data collection and analysis
- Remote control of viewing recording/triggering of a system
- Ability to test in areas that may have safety risks, such as machine setup or production line spot checks
Requirements include:
- Tablet must have a USB A 2.0 connection
- Each tablet must have its own software license
- Only for use with one Evolution handle
- I-Scan software must be version 7 or above