- Home
- Companies
- Dakota Technologies, Inc.
- Services
- Dakota - 3D Visualization Services
Dakota - 3D Visualization Services
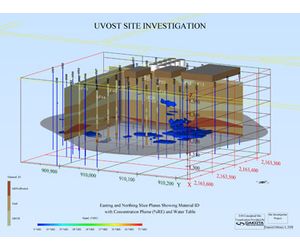
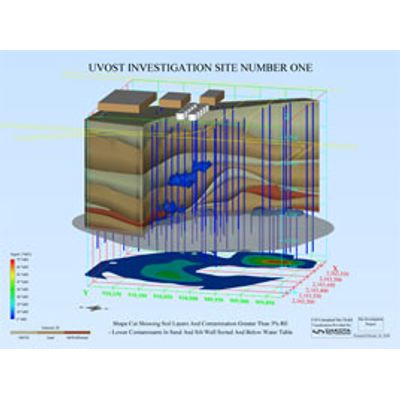
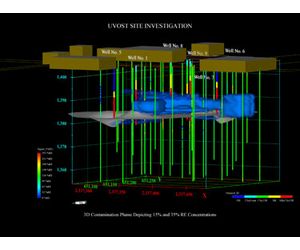
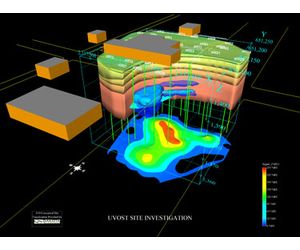
Dakota provides the capability to view TarGOST®/UVOST®/DyeLIF/MIP/HPT site characterization data in static or dynamic format with unparalleled resolution to deliver a 3D and 2D representation of the conceptual site model. High resolution, direct sensing data such as laser-induced fluorescence (LIF), MIP, HPT and electrical conductivity (EC) greatly enhance the accuracy and usefulness of the model.
High resolution GIS imagery and traditional basemap features, such as CAD drawings, topographic maps, or aerial photographs, may be combined to represent the ground surface in three dimensions, with the photographs or maps precisely placed on the topographic surface. The three-dimensional models may then incorporate lithologic information from boring logs, as well as analytical results from soil and groundwater samples. The synthesis of this information into an interactive database visualization tool allows the distribution of contaminants to be clearly shown within the hydrogeologic frame-work and can be used to demonstrate how the various media interact in the subsurface.
TarGOST/UVOST/DyeLIF/MIP/HPT data logs are typically acquired at 1 inch or less vertical resolution, which is orders of magnitude higher resolution than traditional sampling methods. Dakota`s key advantage is high accuracy in the contamination models. When visualized in 3-D, contaminants migrating in narrow seams of sand, silt, or gravel are easy to see. The high data density of LIF reveals these types of contaminant distribution features often missed by conventional methods. Dakota`s interpolation algorithms combined with the high density LIF data produce a high correlation between individual LIF data logs and the 3-D source term model.
- 2-D (fence or cross section) and 3-D models such as Plume and Stick provide a variety of methods to best represent the log data
- Choose a variety of display formats including static graphics and dynamic video
- Overlay site aerial photographs or satellite images onto the model
- Integrate Dakota’s visual models with client’s existing AutoCAD drawings
- Fast turn-around time
High Resolution
- Vertical resolution less than 1 inch
- Log interpolation between direct push locations using a highly accurate modeling algorithm
Customizable - Static visualization of subsurface features to ease data interpretation
- Dynamic full 360-degree fly-by video
- Add surface contour and buildings to gain perspective and ease data interpretation
Save Time & Money
- Optimize placement of validation sampling and treatment technologies
- `Machine Vision` eliminates subjectivity typical during boring analysis
Value - Visualize the `big picture`
- Superior communication tool
- Consultants can produce high quality results for their clients