

Starpoint Software Inc.
Super Slug - Aquifer Slug Test Analysis Software
This program represents a breakthrough in computer analysis of real-world slug test data. No other program can match its reliability and ease-of-use. This program will save you hours in analysis time. It is a must for large projects. Considered by many to be the easiest and most complete application for slug test analysis.
Most popular related searches
slug test
slug testing
aquifer test
aquifer testing
water level data
aquifer test software
aquifer
aquifer analysis
data logger
field data
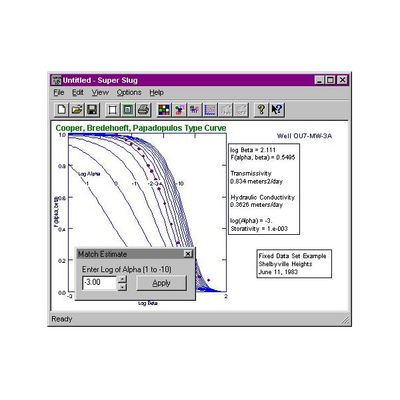
- Cooper, Bredehoeft, Papadopulos On-Screen Type Curve Matching
- Bouwer and Rice Graphical Analysis
- Bouwer and Rice Automatic Parameter Estimation with Sensitivity Analysis
- Hvorslev Graphical Solution
- Hvorslev Automatic Parameter Estimation
- Ferris and Knowles Automatic Parameter Estimation
- Automatic determination of head ratio
- Import data from time and drawdown data logger files without prior editing
- Automatically adjustment of data so that maximum head change occurs at time = 0, with manual override
- Specifically designed to work on actual field data without user editing, and extensively tested on numerous real-world data sets
- Five types of data graphs
- Extensive ability to exclude unwanted data points from analysis
- Accept and graph data from slug tests where the water level oscillates beyond the original level
- Drag-and-drop type curve matching for Cooper method
- Simplification of Auto-Solve methods
- Bouwer and Rice Auto-Solve method calculates flow rate into the well (based on Herman Bouwer`s 1989 article in Ground Water
- Super Slug provides a drag-and-drop implementation of the Cooper, Bredehoeft, Papadopulos type curve method. This is the only slug test analysis method that will provide an estimate of aquifer storativity. (18490 bytes)
- All aquifer testing programs support full printing and print preview with customizable options. Here is the Hvorslev graph in print preview mode. (17778 bytes)
- Bouwer and Rice graph showing full lines for the vertical scale. All calculation results are displayed in moveable, customizable text boxes. Just click and drag to reposition them. (14960 bytes)
- Here is a Bouwer and Rice graph showing exclusion of data points at the beginning and end of the test to allow a better fit of the line to the data. Super Slug provides extensive flexibility for fitting the line to data. The buttons on the bottom left and right corners of the screen exclude or include data from the analysis. (18093 bytes)
- Here is another example of the Hvorslev analysis. Super Slug`s Hvorslev method also supports partial penetration. (17813 bytes)
- Super Slug will graph and analyze oscillating water level data, as in this example. (14076 bytes)