

BREEZE 3D Analyst - Analyze and Visualize Data Model
BREEZE 3D Analyst is a powerful post-processor that enables you to analyze and visualize data in multiple formats to help you better understand, interpret, and summarize your modeling results. It is also useful for analyzing meteorological, terrain, and concentration data. From taking a quick look at modeling results to performing a detailed source contribution analysis to generating customized graphics for a report, 3D Analyst helps you get the most out of your model results with the least time and effort.
3D Analyst Met
The BREEZE 3DAnalyst Met stand-alone package includes enhanced features and new functions to analyze complex meteorological datasets. With this product, users can open CALMET, 3D data, .ARL, ASCII, and binary files to analyze the data using the user-friendly interface of BREEZE 3DAnalyst.
Price: $2,995.00
3D Analyst Results
With BREEZE 3DAnalyst Results, users have the ability to open a wider variety of file types than is capable with the Met edition. Users can open plot, 3D.dat, raw, CALPUFF, HYSPLIT, CAMX, ASCII, H3D, and AERMOD files, among many other file types, for use in their modeling projects, while also taking advantage of the post-processing utility for hourly NO2 and SO2 results that is included in the product.
Price: $995.00
3D Analyst Ultimate
The BREEZE 3DAnalyst Bundle includes the Met and Results modules, thereby combining the features included in these stand-alone products to result in a more powerful and flexible product. With this product users can open a large variety of file formats, and analyze data and/or results for a model run.
Price: $3,990.00
Key Features
- Import, visualize, and post-process data from AERMOD, CALMET, CALPUFF, Incident Analyst, and other BREEZE software
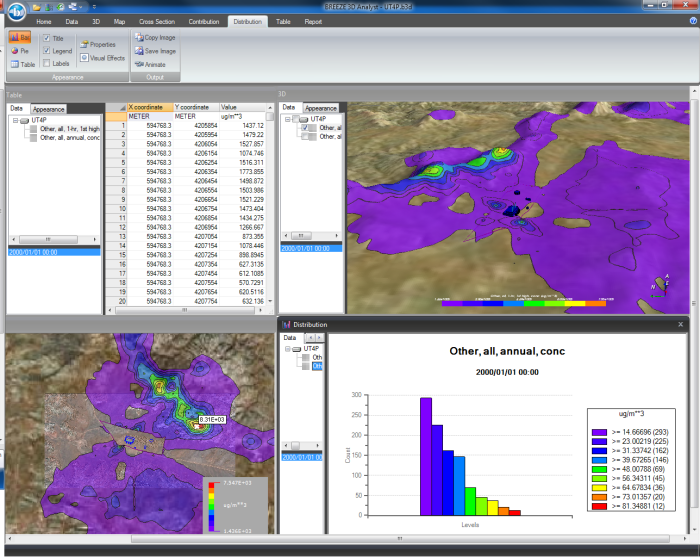
- View results in 3D, 2D, as a time series, and in table format
- Customize graphics easily, choose from: scale bars, map overlays, high-value markers, and contour color scales
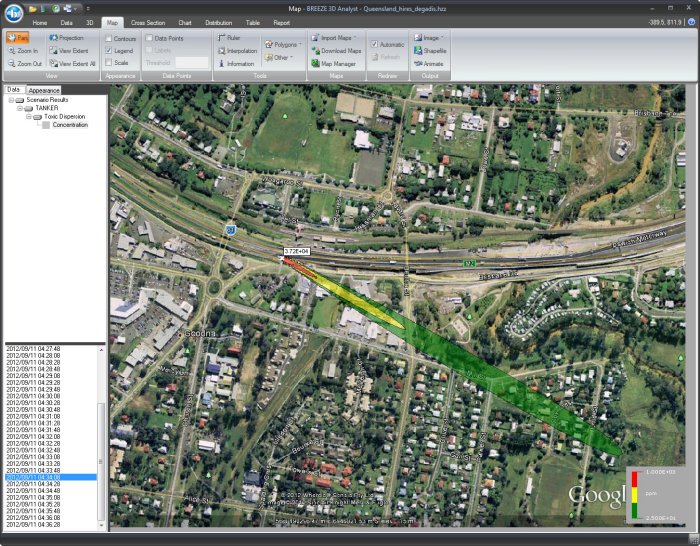
- Plot results in Google Earth™ (.kmz), Surfer®, or Scalable Vector Graphics (SVG) formats
- Compute averages, percentile values, and high values
Whether plotting blast damage radii from results obtained in BREEZE Incident Analyst, graphically pinpointing the maximum concentrations in your AERMOD results, or analyzing the 3D wind flow around a mountain in your CALMET data, 3D Analyst is an indispensable tool that enhances your productivity when analyzing a variety of scenarios.
Read the BREEZE 3D Analyst 2.3.2 Release Notes
Read the BREEZE 3D Analyst 2.3 Release Notes
For the full list of features and bug fixes, read the Release Notes above.
What`s New in 2.4
- Increased efficiency with the updated map control that includes significant improvements to the Map view
- Added a feature to display base maps in the Map tab alongside with contours of .b3d data extracted from AERMOD archive AMZ files
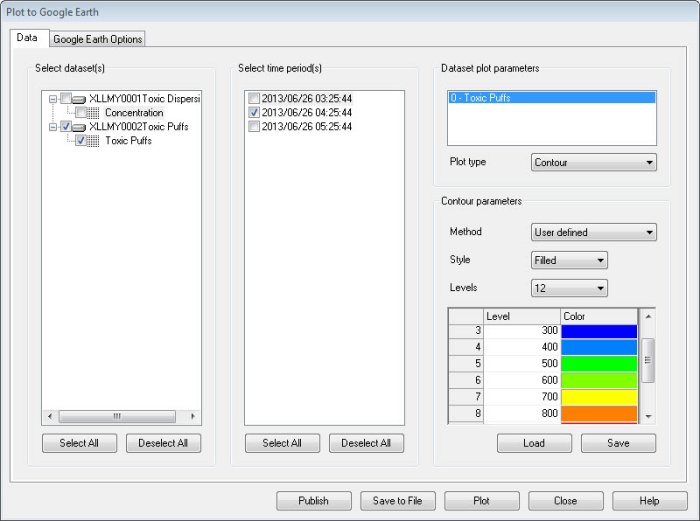
- Added the ability to customize legends for the concentration contour plot in Google Earth
- Improved the plot-to-Surfer function so that when there are concentration contours of different time periods to plot, each time period is plotted to an individual layer in the same plot file instead of creating one plot file for one time period
Results Visualization
- Import, visualize, and post-process data from AERMOD, CALMET, CALPUFF, Incident Analyst, and other BREEZE software
- View results in 3D, 2D, as a time series, and in table format
- Overlay results on basemaps (imported automatically from BREEZE software or basemaps added yourself)
- Customize graphics easily, choose from: scale bars, map overlays, high-value markers, and contour color scales
- Visualize contribution of each source to overall concentration with Contribution view
- Automatically calculate and plot the radius from a source to a threshold concentration
- Sort data in spreadsheet format with Table view
3D Tools
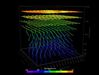
- Visualize plumes and wind vectors in 3D for a new level of understanding
- View 3D isosurfaces and color-filled volumes
- View horizontal and vertical cross-sections
- Rotate, zoom, and pan to view results from every angle
Export Options
- Export results as images (.jpg, .png, .bmp, .gif, .tif)
- Export animations (.avi) to see results as a function of time
- Export results as GIS shapefiles
- Plot results in Google Earth™ (.kmz), Surfer®, or Scalable Vector Graphics (SVG) formats
- Produce line, bar, and pie charts from results
- Save data to an Excel file or a text file with user-customized format
- Save the Appearance settings for the model result graphics, including the settings for Contour Levels
- Save data and project templates under the BREEZE Application button
Post-Processing Tools
- Compute averages, percentile values, and high values
- Calculate data transformations (e.g. multiply by or add a constant)
- Find all values that exceed a specified threshold
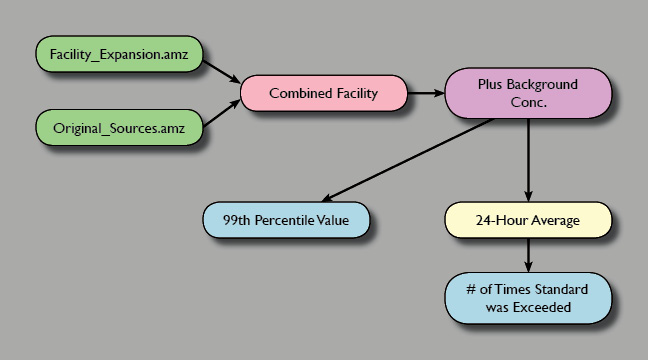
- Merge (add, multiply, etc.) or combine together multiple data files
- Automate common workflows with Data Flowchart utility
- Conduct source contribution analyses with Contribution tools
Seamless Integration with BREEZE Models
Just finished a model run in a BREEZE application? In just one click you can import your results, save a report figure, combine with an earlier run, or export to Google Earth. In addition, all of the map images, AutoCAD files, and shapefiles you loaded into a BREEZE modeling application will carry over to BREEZE 3D Analyst.
One 3D Analyst, Many Models
BREEZE 3D Analyst can read numerous data types: model results from AERMOD, ISC, CALPUFF, and BREEZE Incident Analyst (toxic, fire, and explosion models), .DEM-format terrain data, and CALMET meteorological data files.
Easily access 3D Analyst from BREEZE AERMOD with just one click.
Easily access 3D Analyst from BREEZE Incident Analyst with just one click.
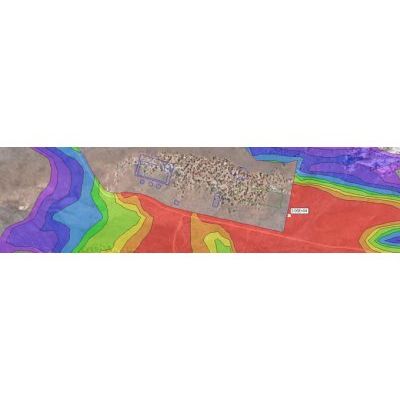
With options including 2-D and 3-D contour plots, charts, and export of results to Google Earth and GIS software, BREEZE 3D Analyst’s graphical results give your data clarity and power.
Graphical Results in Many Forms
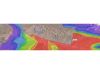
BREEZE 3D Analyst provides many ways to graphically display results. Create 2D or 3D plots (all overlaid on your map images and/or terrain data), pie charts showing which sources contribute the most to high concentrations, and animations showing how a plume evolves over time. Whatever your results, one of 3D Analyst’s many visualization options will help you better understand, explain, and summarize your findings. With its ability to plot 3D meteorological fields and wind vectors, 3D Analyst also makes it easier than ever to understand and evaluate meteorological data such as CALMET output.
Export Results Conveniently
BREEZE 3D Analyst results can be saved as an image or animation as well as exported to a number of external programs, including Google Earth (.kmz files), Surfer, GIS utilities (shapefiles), and scalable vector graphics (SVG) files. 3D Analyst works with the software you already use, allowing you to do more with your results.
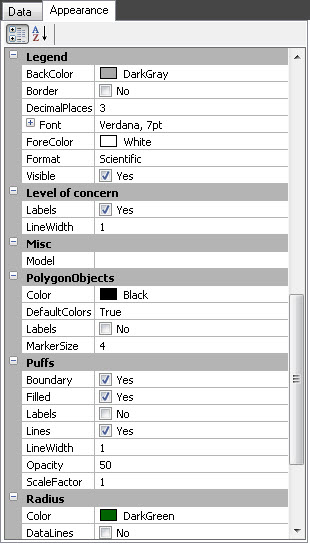
Customize Everything
BREEZE 3D Analyst provides a wide range of customization options so that your figures will be as attractive as they are informative. Adjust the color scale and opacity of your result contours, increase the font size on your legend, add a scale bar, or pull in an extra background map to overlay your results on. Then save your color scale so you can use it on your next project.
In addition to its graphical capabilities, BREEZE 3D Analyst provides an array of powerful tools for post-processing data.
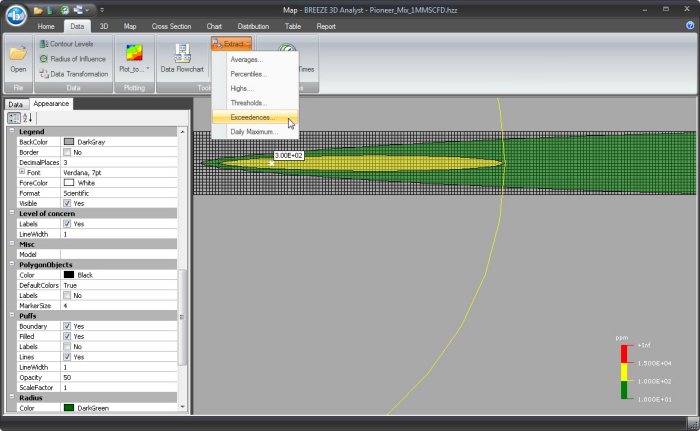
Extract the Critical Information
Need to know the 99th percentile concentration in your data, compute 6-hour rolling averages, or create a map showing where and how frequently a threshold value was exceeded? 3D Analyst can do all of this in a matter of seconds. Intuitive tools allow you to pull out exactly the information you need to understand the situation, comply with regulatory standards, and make the right decision.
Data Manipulation Makes Modeling Faster and Easier
Need to add a background concentration to all of your results, or multiply everything by a factor to test a new emissions scenario? A few clicks in 3D Analyst will save you from having to re-run your model, and you will immediately see your changes reflected in the graphs, maps, and animations produced by the program. 3D Analyst also makes it easy to combine data files. Whether you need to add together the results from six different sources, pull results from five years of modeling into one file, or calculate an emissions increment by subtracting one model run from another, 3D Analyst can do it in seconds.
These are the technical requirements for 3D Analyst.
Hardware- Intel or AMD processor, 32 or 64 bit. 500-megahertz (Mhz) or higher
- 300 megabytes (MB) available disk space for the application install. Meteorological data files may require significantly more
- 1 gigabyte (GB) RAM
- 1024 x 768 minimum display resolution
- Video card with 3D hardware acceleration required for 3D views
- 3D features require a video card that supports DirectX 9
- Mouse or other pointing device
- Windows 10, Windows 8, Windows 7, Windows Vista, Windows Server 2003, Windows Server 2008 or Windows Server 2012
- Microsoft .NET Framework 2.0 or later
- Raw meteorological data for surface, upper air and/or onsite data sets or model-ready meteorological data