

Most agencies have the ability to capture data from day-to-day operations and research. dTIMS BI saves your agency time by analyzing complicated data and turning it into intelligence.
dTIMS BI enables an agency to streamline the data analysis process so information can be shared quickly and collaboratively between departments. Bring your enterprise together in one place.
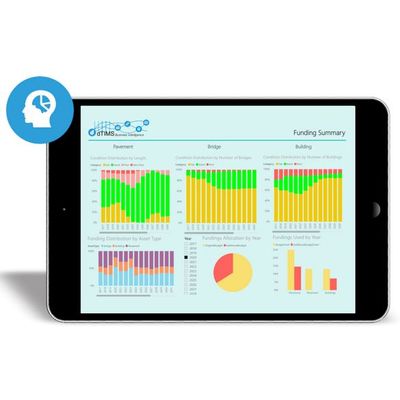
All of the information you need is centralized in a dashboard format, in an easy to read, one page analysis summary. Any stakeholder can leverage the power of dTIMS.
Get insight into the condition of your pavement network at a glance. What condition is your network currently in? What will it look like in 15-20 years? Drill down into more detailed information on a specific sub-network.
View overall network bridge condition detail, health index, and NBI ratings (including culvert rating, deck rating, structural condition, sub- structure, and super structure ratings).
View the cost distribution based on stormwater inventory. View inspection data based on illicit discharge inspection forms. View encroachment evidence data based on inspections.
An automated reporting process captures analyzed data. Reports can be in the form of statistical data, visual charts, and/or standard textual content.
When a BI visual has a hierarchy, you can drill down to reveal more granular information. Move from high-level charts to more detailed, tabular information.
What are the effects of decreasing our maintenance budget by 5%? Change your BI parameters and view the impact in charts.
Get a view of which work orders have been scheduled, completed, and past due. Managing the backlog of work requests is a key responsibility of maintenance department leaders. Making decisions based on priority work and keeping the schedule up-to-date is critical.
Find out the time spent performing a job. Consistently underestimating the time it takes to complete a job can lead to your agency paying too much in overtime labor costs.