
CDLSmartHub - Data & Reporting Interface Software
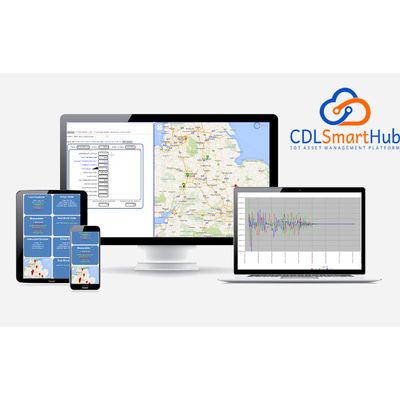
Any Time, Anywhere: The CDLSmartHub app is accessible from any smart phone, tablet, laptop or PC without having to install software or apps. Highly Secure: All data is securely hosted by a third party server facility. Flexible IoT Dashboard: Our own IoT reporting platform offers geo positioning, real time remote monitoring data, configure and manage devices, alarms, audit trails, graphs and trends, dashboards, visualisations and analytics!
Data is not information and information is not knowledge. Getting data to the cloud safely, with integrity checks, getting configuration instructions back to the sensors (e.g. sampling and reporting frequencies) is just the start. Turning that data into useful information for you is the next step – things like dynamic charting, customisable hierarchies, user defined alarm functions, geo-mapping, intuitive work methods.
Our culture of working with clients in partnership and focusing on a small range of applications means we can help turn information into knowledge – on which you can act.
This is through server based algorithms to analyse and interpret information how you want and send you the resulting knowledge specific to your sector with your vocabulary and a drill down structure to get as close as you wish to the raw data.
Compatible on any standard web browser:

CDLSmartHub IoT Dashboard - This platform is the heart of your system! Receive data. Interpret Data. Manage Data. Control Systems. Share Information. Add Value.
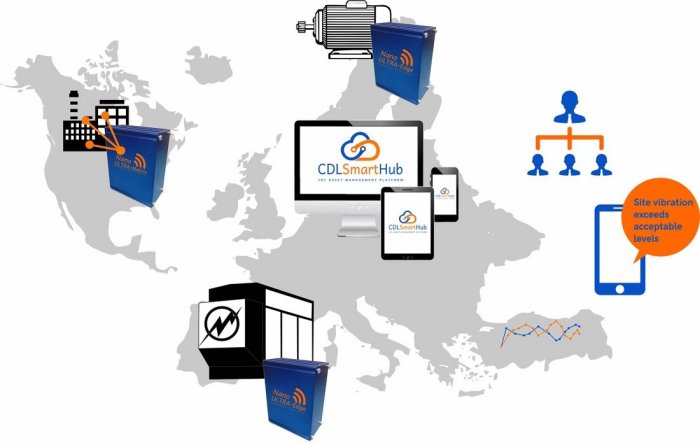
Live Remote Asset Monitoring Data Map
Want to be able to see all of your sensors and equipment in their current locations? Access data from your sensors and equipment without having to go to site? And know immediately from one screen whether it`s online or not? The CDLSmartHub by Caption Data provides a live map with all of your sensors and equipment, and gives you live data and information about their condition.
Click on a map marker to see live and historic data from real world sensors, or hover over a map marker to view the last recorded measurements.
Key
Hover over or click on a marker to find out more about the sensors and data being collected from that location.
- Map Marker Green
- Power Monitoring
- Map Marker Yellow
- Temperature and Relative Humidity (RH) Monitoring
- Map Marker Red
- Shock and Vibration Monitoring
Other parameters that we can measure:
Co2, Wood Moisture Equivalent (WME), dew point, water quality, instrumentation output, Modbus, Canbus. See an extensive list here.
- Multilingual, automatic time zone adjustment, metric or imperial units. Find out more about our international offering.
- Simple, clear, fast menu structures
- Dynamic charting – automatic time zone adjustment worldwide, auto axis scaling, cut and paste, email colleagues
- Quick access to help, tips, FAQs and providing feedback
- Quickly choose your unit, select sensors / parameters to plot and timezone
- Name units and sensors, set high and low alarms, identify alarm recipients, configure sampling and reporting frequencies