

CellRaft Cytometry Software
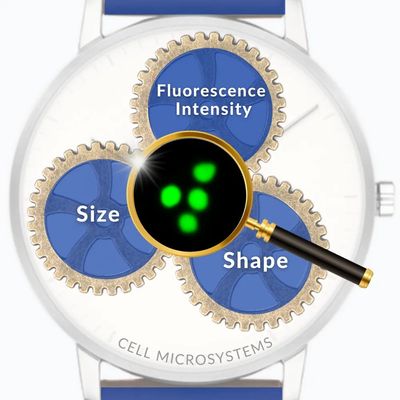
The CellRaft® Technology is powered by our innovative software that controls the automated imaging and CellRaft isolation functions of the platform. Most importantly, the CellRaft Cytometry™ feature allows for software-driven decision-making to identify CellRafts of interest. User-defined attributes ranging from cell shape to colony size to fluorescence intensity allow for precise identification of exactly the desired cells or colonies. The CellRaft AIR® System and software provide a seamless workflow for research, allowing biologists to engage with their engineered cells as they develop into colonies. This powerful tool enables diverse applications to be run on the system to capture the cell of choice from the CellRaft Array.
-
Track and trace capability for image-based record keeping
-
User-defined multiparameter analysis (e.g., time, morphology, phenotype)
-
Easy template creation for defining desired CellRafts
-
Custom population subsetting to assess cell behavior over time
-
Software-guided CellRaft selection
-
Automated CellRaft mapping from population gates for isolation
Users can create unique sub-populations for CellRaft classification using a variety of user-defined parameters. In the example below, the user is looking for single cell derived colonies. The parameters can be created to identify CellRafts that have: a) single cells at timepoint one, b) cells that doubled at timepoint two, and c) contain a confluent colony at timepoint three.