
- Home
- Companies
- Starpoint Software Inc.
- Software
- ChemStat - RCRA Subtitle C & D ...
ChemStat - RCRA Subtitle C & D Statistical Analysis for Windows
Full featured RCRA compliant statistical analysis of ground water data. Includes most methods described in 1989 and 1992 USEPA statistical guidance documents, and other common statistical references.
Environmental Statistical Analysis Software Solution for Windows
ChemStat is the easiest and fastest application available for the statistical analysis of ground water monitoring data at RCRA facilities. ChemStat includes most statistical analysis methods described in the 1989 and 1992 USEPA statistical analysis documents, USEPA Draft Unified Guidance Document, U.S. Navy Statistical Analysis Guidance document, and other guidance documents and methods documented in popular statistical texts.
A unique combination of ease-of-use and innovative technologies make ChemStat the value leader for environmental statistical analysis.
New Features for v. 6.4 (Available July, 2016):
- New Shewhart-CUSUM Control Chart follows "non-standardized" method of USEPA Unified Guidance
New Features for v. 6.3 (Available December 20, 2010):
- Tarone-Ware Two-Sample Test - A non-parametric test comparable to the Wilcoxon presented in the USEPA Unified Guidance.
New Features for v. 6.2 (Available April 1, 2007):
- Non-Parametric Confidence Limit MCL Comparison.
- Parametric Prediction Limit (inter-well) with verification resampling as described in USEPA Unified Guidance, for the following resampling schemes:
- 1 of 2
- 1 of 3
- 1 of 4
- Modified California
New Features for v. 6.1 (Available March 25, 2006):
- Export Workbook reports and graphs directly into Microsoft Word.
- Improved Workbook printing to Acrobat PDF files.
New Features for v. 6.0 (Available July 23, 2005):
- New methods for compliance with USEPA Draft Unified Guidance:
- Rank von Neumann test
- Spearman`s Trend Test
- Welch`s t-test
- New features for adjustment of data (add/remove samples based on date ranges, parameter names, well IDs)
- Improved Prediction Limits
- Improved Control Chart
- Improved Probability Plot
- Improved Graphs and Reports
New Features for v. 5.2:
- New Upper Confidence Limit (UCL) Methods Including:
- Student`s t-test UCL Method
- Chebyshev Inequality UCL Method
- Central Limit Theorem UCL Method
- Bootstrap Resampling UCL Method
- Jackknife Procedure UCL Method
- Improved Probability Plot for Censored and Detects-Only Plots
New Features for v. 5.0:
- Improved graph vertical axis scaling
- Method Selector Tree -- Hierarchical tree simplifies the selection of the appropriate statistical tests.
- Poisson Prediction Limit not available as intra-well comparison
- New statistical methods, including methods from U.S. Navy (1999) statistical guidance documents.
- Improved Parametric t-test
- Satterthwaite t-test
- Quantile Non-Parametric test
- Two Sample Test of Proportions MCL Comparison
- Slippage Non-Parametric test
- Improved Wilcoxon test for group comparisons (following U.S. Navy Guidance)
- Discordance Outlier Test
- Enhanced parametric t-test follows U.S. Navy (1999) Guidance
New Features for v. 4.1:
- Parametric t-test analysis.
- Confidence interval analysis by Land`s formula for log-normal data.
- Two-tailed parametric tolerance limits
New Features for v. 4.0:
- Fully automated statistical analysis -- perform a complete statistical analysis of an entire data set with a single command.
- Batch Processing -- Automated statistical analysis with scripts (create a script of commands for a list of parameters and perform all commands at once).
- Direct import of Sanitas® and DUMPStat® databases.
- Improved support for different parameter units.
- Automatic elimination of outliers.
- Mann-Kendall supports testing for upward, downward, or two-tailed trends.
New Features for v. 3.0:
- Easier File Importing -- File importing has been simplified. Preview the file to prevent formatting mistakes.
- Summary List summarizes of all wells showing statistically significant contamination for your project, showing parameter name, transformation, and statistical method.
- More Transformations -- In addition to natural logarithm transformations, you can choose log base 10, square root, or cube root transformations.
- Probability Plot Correlation Coefficient
- Data set size limited only by computer memory for most tests
- Unlimited number of parameters
- Unlimited number of wells
- Unlimited number of sample dates
- Unlimited parameter name and well label length
- Easily exclude individual data points from analyses
- Fast Performance
- Full report and graph printing and print preview
- Export reports to tab-delimited ASCII text file
- Export reports to a word processor in rich-text format
- Numerous choices for page headers and footers, page left, right, and center
- Choice of multiple fonts and colors in graphs and reports
- Highly customizable user-interface
- Easily select parameter for analysis from drop-down list
- Complete on-line help with "what`s this" context sensitive help.
- Advisor Window displays information about the method and suitability of the method to the data set.
- Method selector tree allows easy selection of the appropriate statistical test for your data
- Quickly convert from original data to log-transformed and back
- Easily represent non-detects with 0, 1, DL/2 or DL for any test
- Accommodate censored data with Cohen`s or Aitchison`s adjustments
- ChemStat is powerfulChemStat is easy to learn Data Set Transformations
- Box/Whisker Plots
- Single Well Concentration vs. Time Plot
- Multiple Well Concentration vs. Time Plot
- Multiple Parameter Concentration vs. Time Plot
- Probability Plots
- Shewhart-CUSUM Control Chart for both Intra-Well or Inter-Well Comparison
- Exponentially Weighted Moving Average Control Chart for both Intra-Well or Inter-Well Comparison
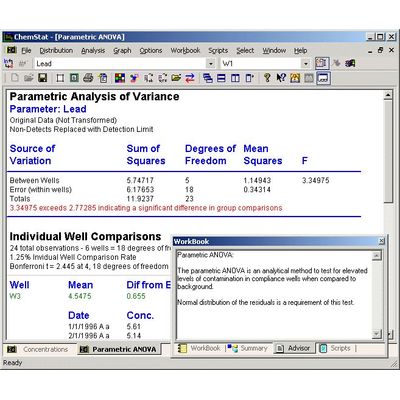
- Parametric ANOVA with Individual Well Comparisons
- Parametric Prediction Limit (intra-well or inter-well comparison)
- Parametric Tolerance Limit (comparison to background)
- Parametric Tolerance Limit (comparison to MCL)
- Parametric Confidence Interval
- Parametric t-test
- Satterthwaite t-test
- Welch`s t-test
- Kruskal-Wallis Non-Parametric Analysis
- Wilcoxon Rank-Sum Non-Parametric Analysis (intra-well comparison)
- Wilcoxon Rank-Sum Non-Parametric Analysis (inter-well comparison)
- Poisson Prediction Limit
- Poisson Tolerance Limit (comparison to background)
- Poisson Tolerance Limit (comparison to MCL)
- Non-Parametric Prediction Limit (intra-well or inter-well comparison)
- Non-Parametric Confidence Limit
- Gehan`s Test
- Slippage Test
- Quantile Test
- Two Sample Test of Proportions MCL Comparison
- Levene’s Test for Homogeneity of Variance
- Bartlett’s Test for Homogeneity of Variance
- Shapiro-Wilks Test of Normality
- Shapiro-Francia Test of Normality
- Coefficient of Variation Test of Normality
- D`Agostino`s Test of Normality
- Skewness Coefficient Test
- Dixon`s Test for Outliers
- Rosner`s Test for Outliers
- Discordance Outlier Test
- Mann-Kendall Test for Trend
- Spearman`s Test for Trend
- Sen`s Slope Analysis for Trend
- Seasonal Kendall Analysis
- Kurtosis
- Graphs Parametric Methods Non-Parametric Methods Distribution/Outlier/Trend Testing
- Among the methods for inter-well comparisons are the parametric analysis of variance ANOVA as shown here, as well as Kruskal-Wallis and Wilcoxon non-parametric comparisons.
- ChemStat include a powerful and highly customizable Shewhart-CUSUM control chart, for both inter-well and intra-well comparisons.
- Shown here is the multiple parameter time-series plot. Graph any combination of parameters for a single well.
- Shown here is a multiple well time series plot. Graph any combination of wells for a selected parameters. ChemStat spaces the date axis proportional to the actual date value of the sample. ChemStat also plots multiple concentrations for a single date.
- New: ChemStat 2.0 includes improved prediction limits. Verification resampling is supported by allowing you to vary the number of samples for each well compared to the prediction limit. Parametric prediction limit calculations can follow USEPA (1989), Gibbons (1987) one-sided, or Gibbons (1987) two-sided algorithms.
- Here is another view of ChemStat showing Skewness calculations, probability plot, and the Workbook.
- The Workbook acts as a repository for all your reports and graphs. Workbook items are saved with your data, and will not change as you apply transformation to the data set. When you have completed your statistical analysis, you can print the entire workbook, or selected items.
- ChemStat 2.1 adds the ability to easily exclude individual samples from statistical analyses, and then add them back at a later date. This is useful for removing statistical outliers, or reducing the size of the data set for an individual well or background wells.
- New: ChemStat 5.0 adds the Method Selector Tree. The method selector tree simplifies the selection of appropriate statistical methods. Methods are grouped into a logical hierarchy. Double-click a method to run the test.