

Clarity - Air Quality Data Visualization and Air Sensor Network Management Dashboard Software
The Clarity Dashboard makes air quality data accessible, actionable, and easy to understand. Our user-friendly, cloud-based platform visualizes real-time air pollution sensor measurements to inform critical decisions and provides you with all the tools you need to manage your air quality sensor network.
The Clarity Dashboard simplifies air quality data visualization and sensor network management. After kicking off your project, you will create your Dashboard account and sign in securely to access your organization resources and start configuring your Node-S devices and modules.
Once your Node-S and Modules are configured, air quality readings are immediately transmitted via the reliable 3G/4G LTE cellular network to the Clarity Cloud, where your air quality measurements and device telemetry can be securely access via the Clarity Dashboard.
- Instantly access real-time air quality measurements and device status reports with a suite of no-code data visualization and analysis widgets
- Invite colleagues to join your organization for seamless collaboration
- Integrate with our system via API to enhance functionality
- Optionally share air quality data publicly through Clarity OpenMap and Opendata API
There are no extra costs associated with the Clarity Dashboard. Sensing-as-a-Service covers cellular connectivity, data storage, and web app access, ensuring a hassle-free experience.
We take security, ownership, and democracy seriously at Clarity. Here are the four pillars of our data policy we will stand by no matter what.
Clarity does not “co-own” your data. You are the sole owner of your data.
Clarity will never share your data with third parties without your consent.
No black boxes. Everything that your Node-S and modules measure, you see.
If you choose to, make your data public on Clarity OpenMap for easy sharing.
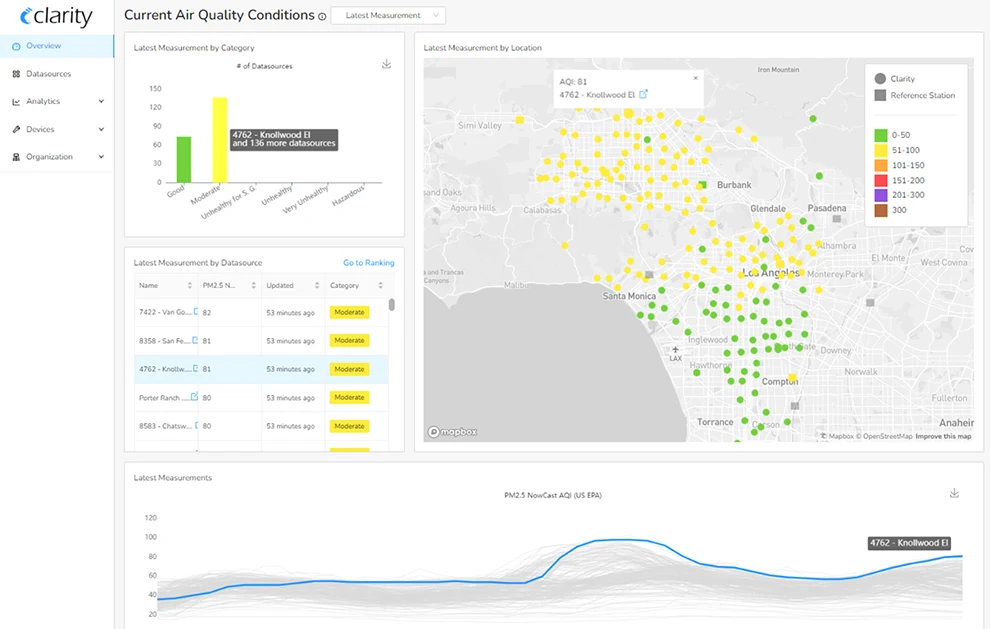
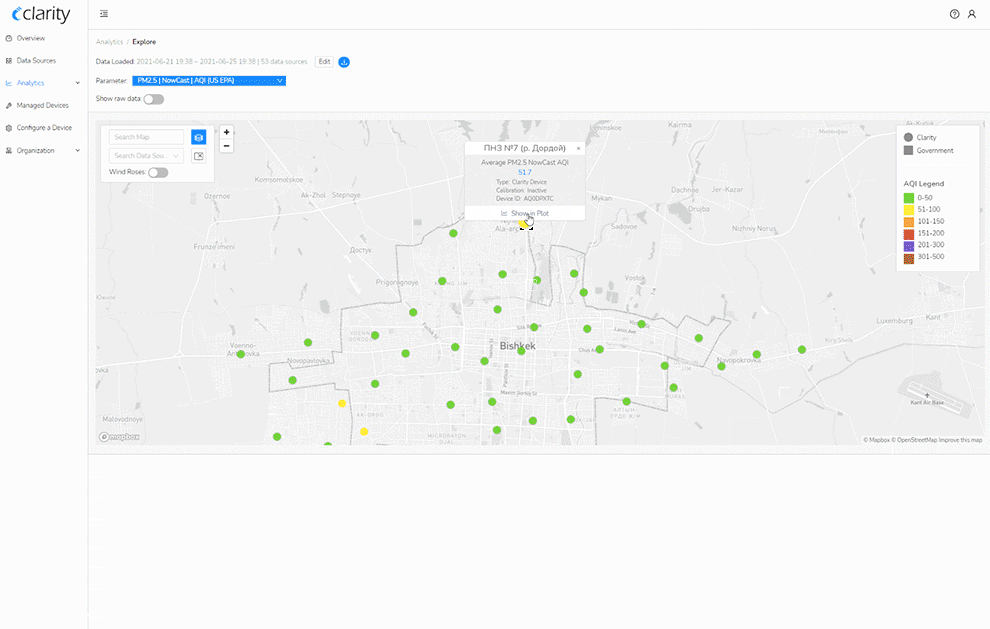
Air Quality Snapshot
Get an instant overview of the air quality conditions at your project site. View real-time air quality data, check recent air pollution measurements, investigate outlier sites, and respond swiftly to changing conditions.
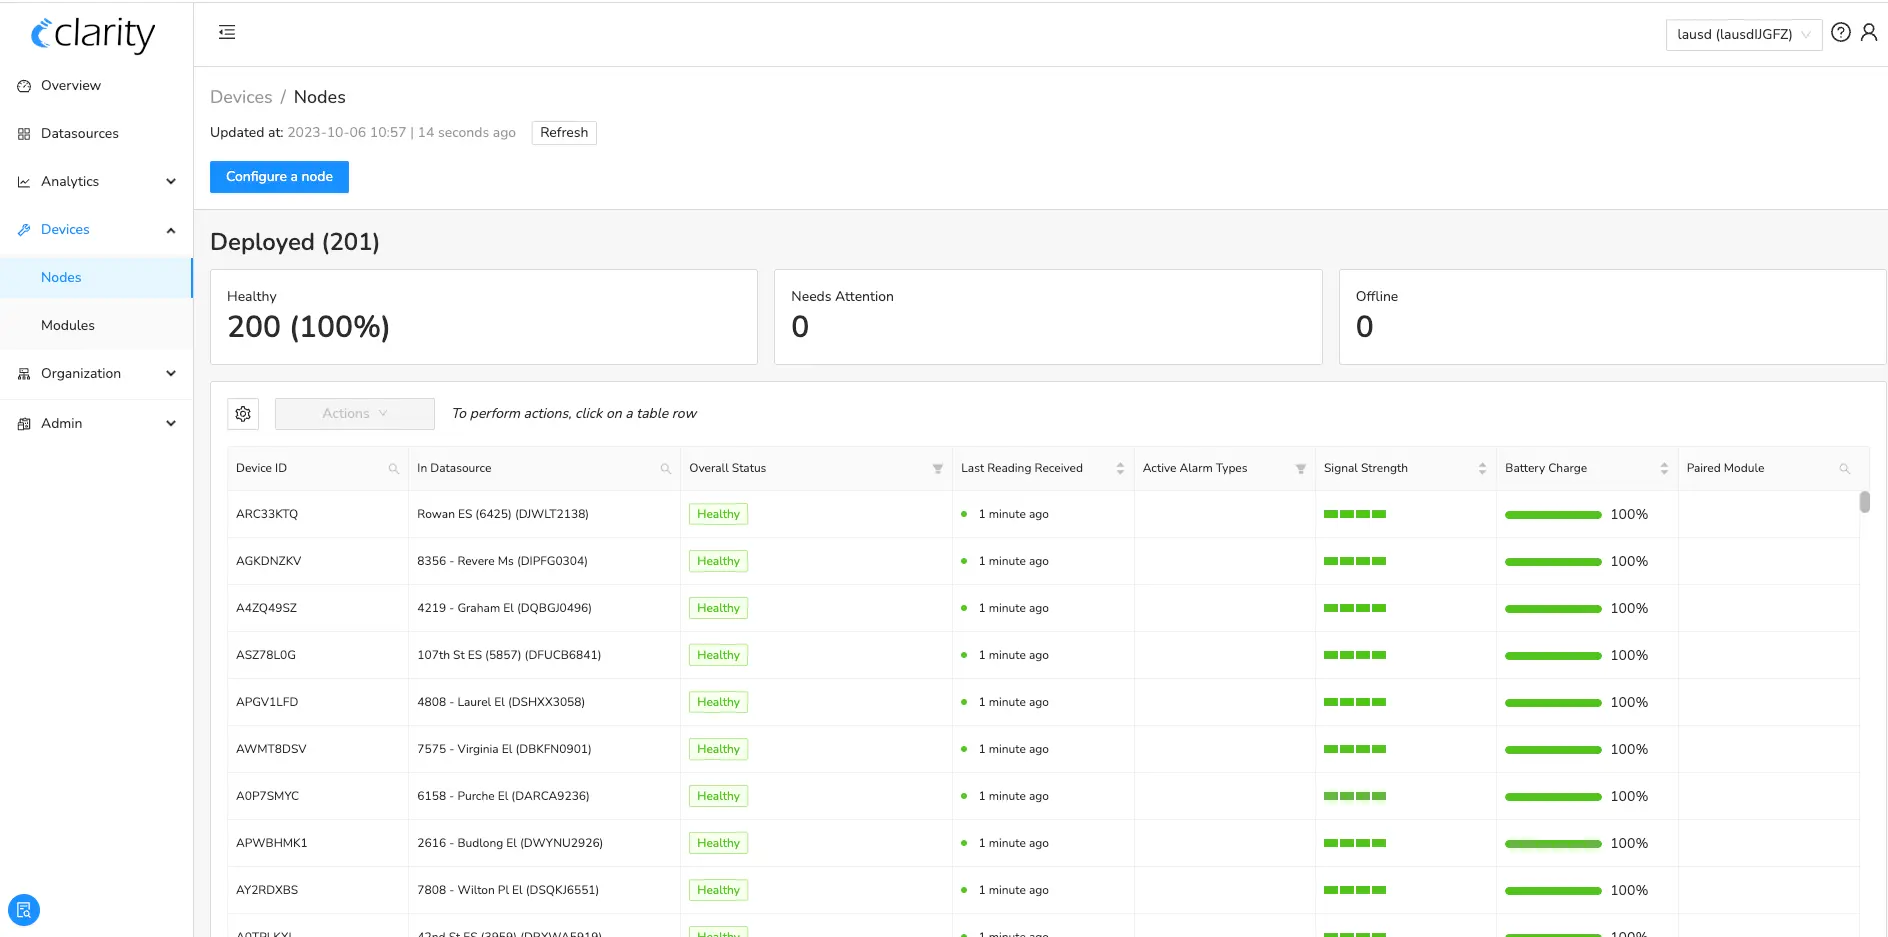
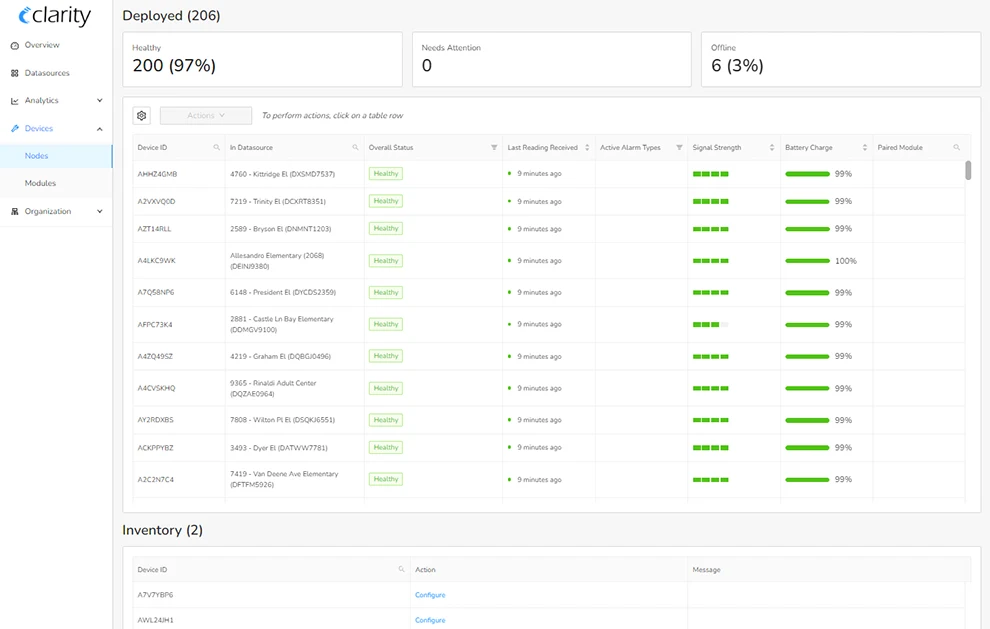
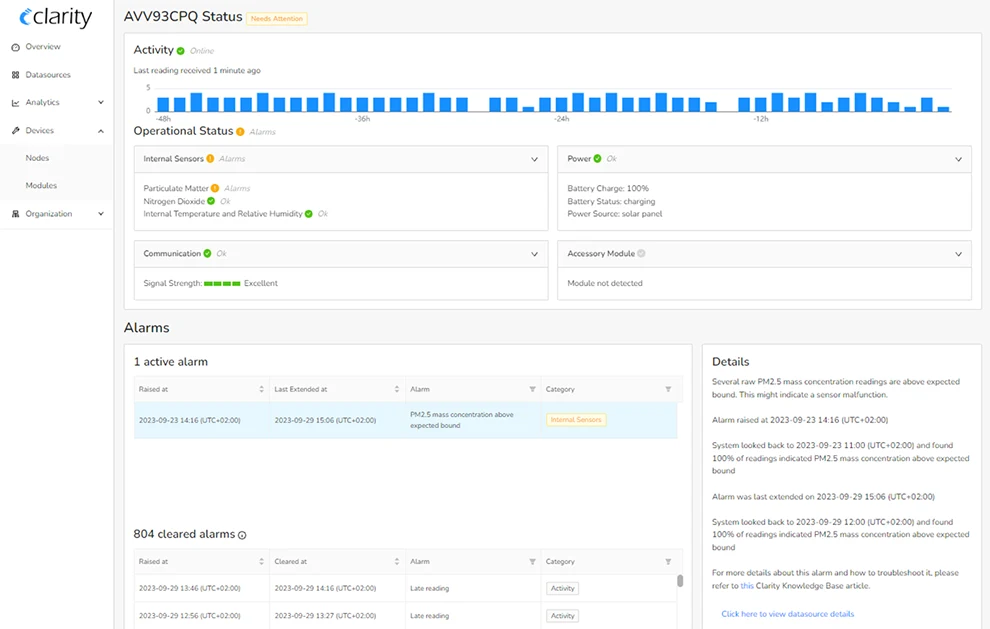
Device Management and Status Tracking
Effortlessly oversee your device fleet`s health and status. Identify offline or unresponsive devices, pinpoint sensor issues, and troubleshoot efficiently using our comprehensive guides. If needed, contact Clarity for a prompt device replacement.
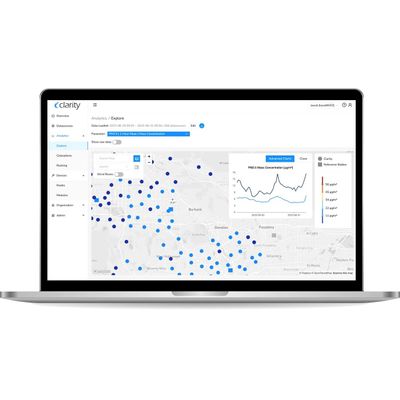
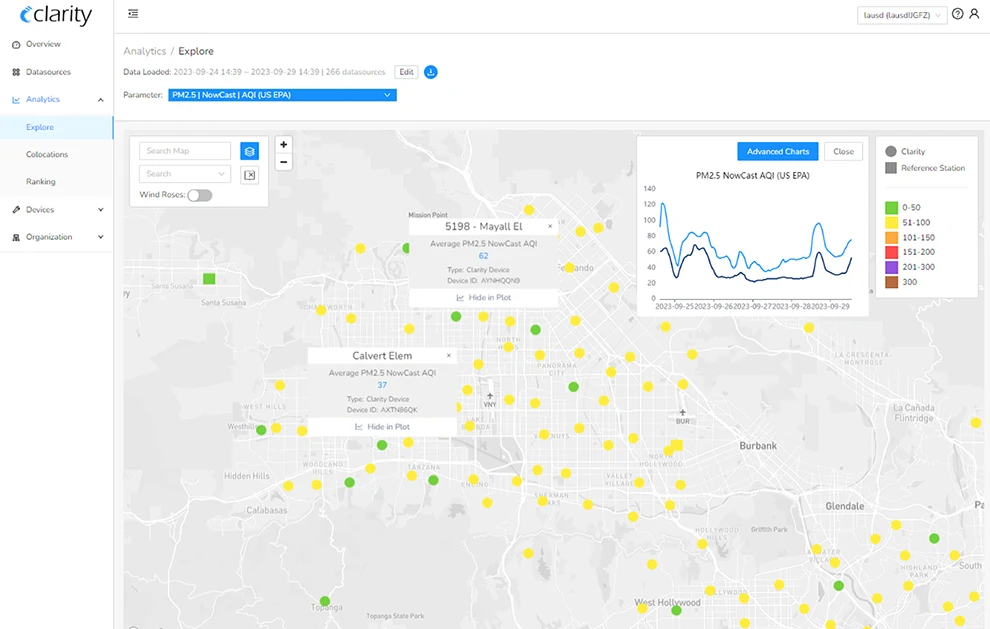
Explore and Download Data
Dive into data exploration with ease. Compare measurements across different locations, customize time periods and aggregations, and export ready-to-present charts for sharing insights with stakeholders. Focus your analysis on specific areas and timeframes, and export .csv datasets for further advanced analysis in your preferred tools.
Advanced Air Quality Visualizations
As you enhance your air quality monitoring network with specialized Modules for monitoring additional air quality parameters, you unlock advanced visualizations like Wind Roses on the Dashboard. These tools empower you to tackle increasingly complex air pollution questions and take targeted actions to improve air quality.
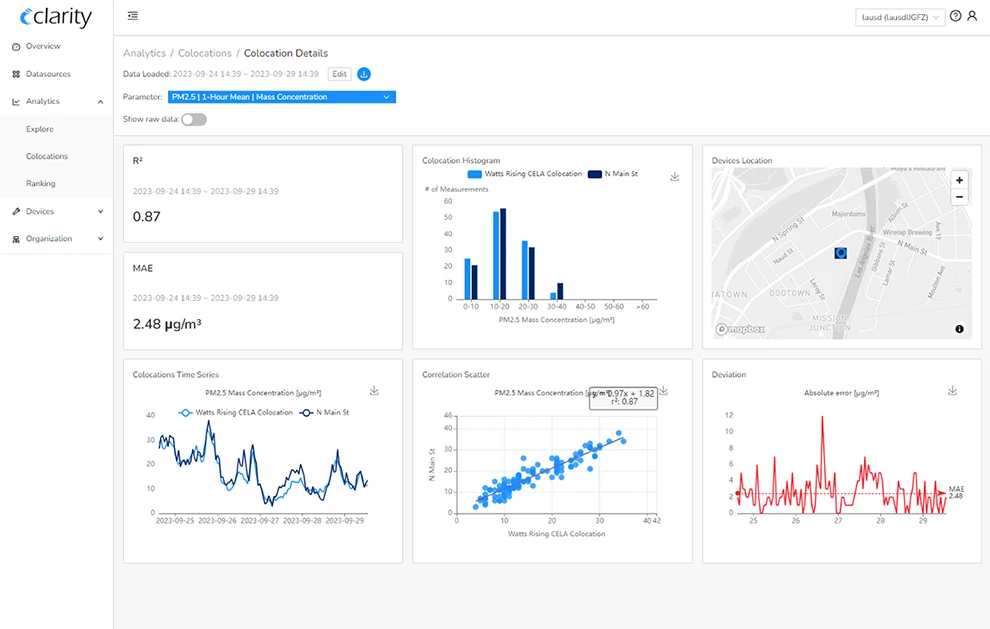
Accuracy Reporting for Collocated Devices
Understand how your air quality sensors are performing relative to reference monitoring equipment. Our dedicated collocation reporting view provides valuable metrics like R2, MAE, time series, scatter plots, and more, helping you ensure your data quality objectives are met.
Custom Device Status and Measurement Alarms
Stay informed about your devices` health and measurements. Receive alerts when a device goes offline, becomes unresponsive, or encounters sensor issues. Define custom thresholds and rules to trigger notifications when specific air pollution measurements or combinations of measurements exceed predefined air quality limits.
User and Data Access Management
Manage your organization`s users with precision. Assign roles with varying permissions: Org Admins oversee projects, Technicians handle device deployment and maintenance, Analysts focus on data exploration, Observers have read-only access to resources, and Guests can view a subset of the organization`s datasources. Additionally, add applications to your organization and control their permissions to enable automation.
Embrace our API-first approach, allowing you to access all Dashboard information via our Air Monitoring API. Leverage this capability to seamlessly integrate with your existing systems, facilitating streamlined operations and data sharing. Explore our detailed API guide for more details.