

Esri
Esri - Community Analyst
FromEsri
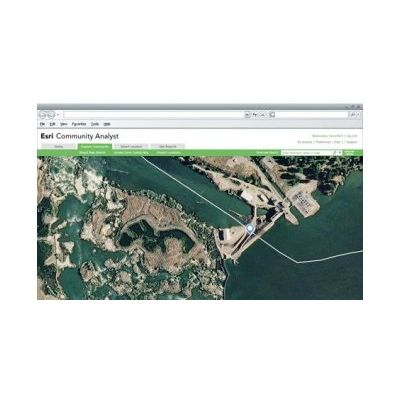
Esri Community Analyst is a SaaS mapping solution that provides GIS capabilities in a simple and easy-to-use framework through a web application, or as an add-in for ArcGIS for Desktop. Thousands of demographic, health, economic, education, and business data variables, combined with instant reports and interactive color-coded maps, allow you to quickly explore the characteristics of any area.
Most popular related searches
Esri Community Analyst has done the tedious work for you. At any level of expertise, the power of data access, visualization, and reporting is available to you instantly.
- The Web Application—With no installation needed, it is a cloud-based mapping solution that provides simple and easy-to-use GIS capabilities to every user.
- The Add-In—For ArcGIS for Desktop users to bring Community Analyst data and reports into the current ArcGIS workflow.
- The API—Build and customize your own web and mobile applications that use Community Analyst data and reports.
Optimize Resource Allocation Decisions
- Prioritize community projects
- Allocate resources for greatest impact
- Understand the types of people impacted by a policy decision
Reach and Inform
- Identify high risk populations using up to five customizable criteria
- Place health clinics for greatest community impact
- Learn more about the types of people that live in at-risk communities and how best to reach them
Up-To-Date Data—Faster
- Get information for the exact area you need—including standard geographies (down to the Census block group level), hand-drawn shapes, or rings or drive times around a location.
- Access thousands of demographic, Census, health, crime, and business variables to formulate better policy decisions.
- Go beyond basic demographics to really understand the behaviors and preferences of people living in any area using Esri`s detailed segmentation profiles.
Resource Allocation
- Use custom comparison reports to determine where to best allocate resources for greatest community impact.
- Quickly find areas with greatest need by using customizable search criteria with the Smart Map Search wizard.
- Determine where to allocate grant funding based on population need.
- Better plan for the future by understanding trends using past data and future projections.
Reach and Inform
- Communicate policy decisions with data and reports customized to your location.
- Illustrate the unique characteristics of your area using interactive color-coded maps to attract businesses and residents.
- Share your findings as PDFs or in Microsoft Excel.
- Reach the public by publishing over 50 pre-formatted reports and maps to your website with your own logo.
- Use a variety of map types to clearly and concisely communicate information.