
Stagraph - Complex Software Tool
Stagraph is a complex software tool for data import - data wrangling - data visualization. Professional software for data engineers, data analysts, data scientists, statisticians and other "data professionals". Power of up-to-date data science tools in a simple to use visual interface.
Reduce
Reduce the complexity of work with the data. With the Stagraph you can do all in one simple-to-use visual environment. Power of data-science languages combined with simplicity of Excel in one tool.
No time-consuming data transfer between several applications. Use one environment for data import, data wrangling and data visualization. Make actionable insights in a few clicks, without coding.
With the Stagraph you are not closed in one solution. Use your results outside the Stagraph environment. Offline or online, in interactive dashboards, reports or in other BI apps and R-based solutions.
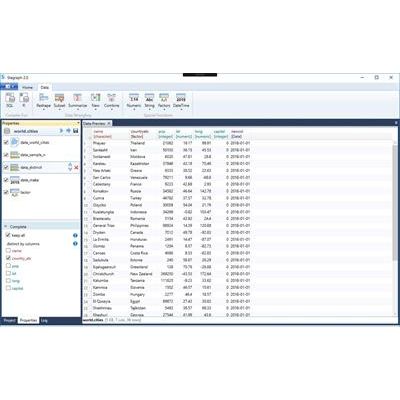
ConnectStagraph interface allows you to connect directly to basic file types (Excel, CSV, DBF), you can load data from databases (via ODBC Connection) or you can create a custom dataset in a build-in spreadsheet. In addition, you can retrieve data from practically any data source using external R packages.
PrepareData cleaning, combining and preprocessing has never been so easy. Stagraph uses top data scientist`s R packages for this purpose. Using the Grammar of Data you can wrangle your data very effectively, quickly and easily inside the best user interface. In special cases, you can also use SQL or R scripts.
ExploreUsing the Grammar of Graphics, you can visually explore your data in the same way as you think. Combine more than 80 geometries, 50 statistical functions, 7 annotation layers, 90 scales, 7 coordinate systems, 6 faceting options, 28 themes and custom objects in a very straightforward user interface. Create highly effective and visually impressive statistical graphics in a few simple steps.
PublishYou can publish pre-processed data and created data visualizations in variable forms - vector or raster, static, interactive or animated, offline or online. In addition, all your steps & clicks in Stagraph are automatically converted into scripts in R language, so you are not closed with your projects under one closed (black-box) technology.