
- Home
- Companies
- Rocscience
- Software
- CPillar - Crown Pillar Stability ...


CPillar - Crown Pillar Stability Analysis
Some of the features available in CPillar v4.0 include:
Probabilistic Analysis
- Monte Carlo or Latin Hypercube probabilistic analysis
- Statistical distributions - normal, uniform, lognormal, triangular, beta, exponential, gamma
New material models
- Generalized Hoek-Brown (GSI, mi, D)
- Generalized Hoek-Brown (mb, s, a)
Empirical Design
- Empirical Design (Trevor Carter 2014)
- Guidelines for use of the Scaled Span Method for Surface Crown Pillar Stability Assessment
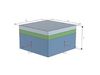
In a Probabilistic Analysis, statistical information can be entered to account for uncertainty in pillar dimensions, lateral stress type, and other parameters. This results in a safety factor distribution for the pillar from which a probability of failure (PF) is calculated.
The general procedure for carrying out a Probabilistic Analysis with CPillar is as follows.
Sampling Options
In the Project Settings dialog you can choose the Sampling Method and Number of Samples.
Defining Random Variables
In order to carry out a Probabilistic Analysis, you must define one or more input parameters (e.g. pillar length, pillar width) as random variables, by assigning statistical distributions to the desired variables and entering the required statistical parameters (e.g. mean, standard deviation).
Compute
If the Autocompute option is turned on, then the Probabilistic Analysis is computed when you change the input data.
Analysis Results
After the analysis is computed, the probability of failure will be displayed in the Results section of the Sidebar display. Detailed results are reported in the Info Viewer. Probabilistic input and output data can be plotted on Histogram plots, Scatter plots, etc. Data can also be exported for further analysis and processing.
There are three analysis options available in CPillar: Rigid, Elastic, and Voussoir.
Rigid Analysis
- Shear (vertical slippage at abutments)
Elastic Analysis
- Shear (vertical slippage at abutments)
- Elastic buckling
Voussoir Analysis
- Shear (vertical slippage at abutments)
- Arch snap-thru (buckling due to gravity)
- Localized crushing failure
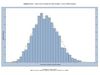
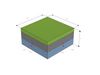
A pillar is defined by its length, width, and thickness (height), or x, y, and z values. These are the first 3 items entered in the Geometry section of the Pillar Information for all three analysis methods. (Depending on the relative magnitudes of x, y, and z, the term pillar, beam, or plate may be most applicable.
In addition, a thickness of overburden can be added above the pillar.
Finally, if the height of water is greater than the (pillar + overburden) thickness, the difference will appear as free water above the pillar.