
Lucid Lab - Cross-Platform Web Application
Our cross-platform web application allows your team to create and manage experiments, stream and monitor data from devices in real-time, and generate plots that are ready for publishing.
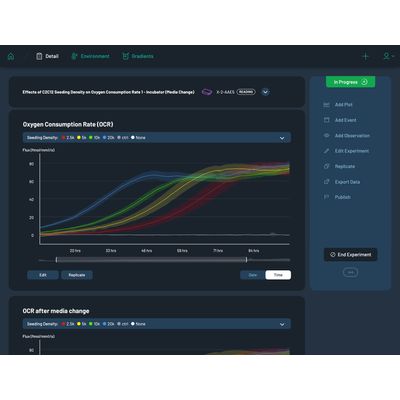
Comprehensive plots
Curate and present the most important data with advanced plotting capabilities. Plots update in real-time for live experiments.
Detailed O2 analysis
High resolution gradient data is presented for all wells comparing response against time and height of Resipher at the time of reading.
Reactive controls
Plate maps, well conditions and plots are interactive and visually connect to help quickly identify correlations and trends.
Adaptable tools
Flexible plate labelling and well mapping tools accommodate all types of experimental conditions.
Quick experiment access
Experiments are compactly displayed for easy search and access. Device status is clearly shown for all live experiments.
Customizable look
Choose from curated color palettes or develop your own.

