

DAPONA - Digital Data Visualization and Alerting Software
DAPONA is a comprehensive digital platform designed to visualize, analyze, and predict data in real-time. It supports data monitoring across various devices such as PCs, smartphones, and large screens, allowing for an easy setup and customization of dashboards through a drag-and-drop interface. Data from multiple sources including machines, sensors, and web services can be integrated and visualized without the need for programming skills. DAPONA`s alert system triggers notifications through email, SMS, WhatsApp, or automated voice messages based on predefined rules. The platform securely connects to local data sources via a REST API, supports integration with external data sources, and ensures data safety through advanced database management and secure storage protocols. Real-time and historical data access is available at all times, enhancing operational efficiency and decision-making processes.
Visualize, analyze, trigger, predict
The individual digital depiction of reality: DAPONA displays data in real time, logs, notifies, generates tasks, alerts, analyzes and creates forecasts. Data visualization and alerting everywhere: on PC, smartphone or large screen. Just connect and go.
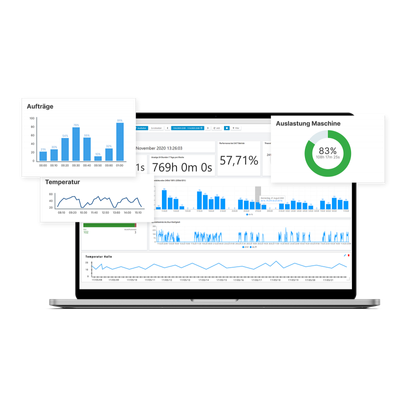
To each his own view, changeable at any time and always on hand: whether on the smartphone, the PC or a large screen.
All data sources such as facilities, machines, workstations, sensors or web services are digitally represented in the data visualization of the DAPONA web dashboards. However individual or distributed the data sources may be and from whatever perspective the data is viewed: Simply set up custom dashboards via drag & drop. Always matching the respective perspective. Without programming, editor or even training: simply and intuitively at any time directly in the web browser.
-
Set up your own dashboards and change them on the go at any time.
-
Simply in your web browswe via Drag&Drop.
-
No programming, designer or app.
Alert, trigger actions
As soon as deviations occur, DAPONA triggers actions, reminds, warns and alerts.
Whether announcements and tasks of the next maintenance, warnings about anomalies, or alerting when limit values are exceeded: Via fully definable rules, any type notification can be easily triggered. The notification can be set up in any desired way, from e-mail, SMS, to WhatsApp or automated voice messages by telephone.
Daily report summarizes events of the last 24 hours.
All actions are logged and reported by e-mail notification upon occurrence or resolution. Additionally, DAPONA summarizes all events in a daily report. Furthermore, evens can be traced back in the real-time dashboards at any time.
Read out data locally, transmit securely
Secure: DAPONA provides a secure REST interface to connect local data sources.
-
Connection of external data sources possible (on request), such as ERP systems, weather services, etc.
Using standard interfaces or retrofitting sensors – we even get old equipment to “talk“.
Safe, open for secure connections (API), completely scalable, self-monitoring
DAPONA stores all data in a secure database to which the customer has secure access at any time via the platform. Through an optimal configuration of the databases in combination with a modern software architecture, we offer a high-performance platform. For additional security, data is stored in a second database for long-term retention.
-
Cache for fast real-time display
-
Secure long-term storage
-
Controlled access at any time
Always see what is happening, no longer miss anything, act in time.