

AICOS Technologies AG
Aicos - Version EasyStat 4.4 -Data Collection Software
EasyStat 4.4is a collection of simple, widely applicable methods for the visualization of data. It facilitates the application of elementary statistical methods.
Most popular related searches
data acquisition software
process monitoring
laboratory data
inspection data
data visualization
laboratory analysis
batch controller
Due to its high user-friendliness, EasyStat is especially well suited for routine use in the laboratory. Typical application areas of EasyStat are analysis of lab data, stability surveys, statistical process monitoring and simple biostatistical problems.
It is validated.
EasyStat is anadd-in for MicrosoftExcel / Windows, version 2000 or higher.
New features in version 4.4:
- Outlier tests (for identifying and classifying extreme values)
- Process capability diagram, with process characteristics and process indizes given: Cp, Cpk, Zst, Pp, Ppk, Plt (for judging the process quality)
- Control Chart for discrete data, e.g. number of defects per batch: p- and u-control charts. It is possible to treat up to 10 defect types simultaneously.
- t-test, with user guidance (comparison of two samples)
- ANOVA (comparison of several samples)
Furthermore available:
- Histogram, stratified histogram, stem-and-leaf diagram (for data inspection)
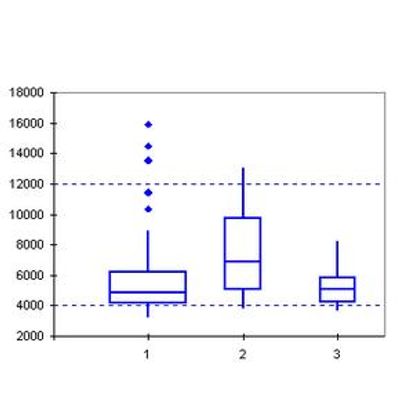
- Boxplot (for compact presentation of data, comparison of groups)
- Quantile plot (for judging distribution normality)
- Summary statistics (mean, standard deviation, median, quartiles, etc.)
- Confidence interval (e.g. to set specifications)
- Scatterplot, normal or with stratification (for finding and better understanding of the relationship between variables); scatterplot matrix, normal or with stratification
- Linear regression, normal or with confidence lines (for quantifying the linear relationship between two variables); prediction and calibration with confidence interval
- Correlation coefficient
- Interlaboratory experiment (for repeatability and reproducibility studies)
- Control chart, also with calculation of Cp and Cpk values, and Cusum chart (for process monitoring, disturbance identification and shift detection)
(Click on pictures to see them in better quality)