
- Home
- Companies
- Data Physics
- Software
- Data Physics - Fast Fourier Transform ...
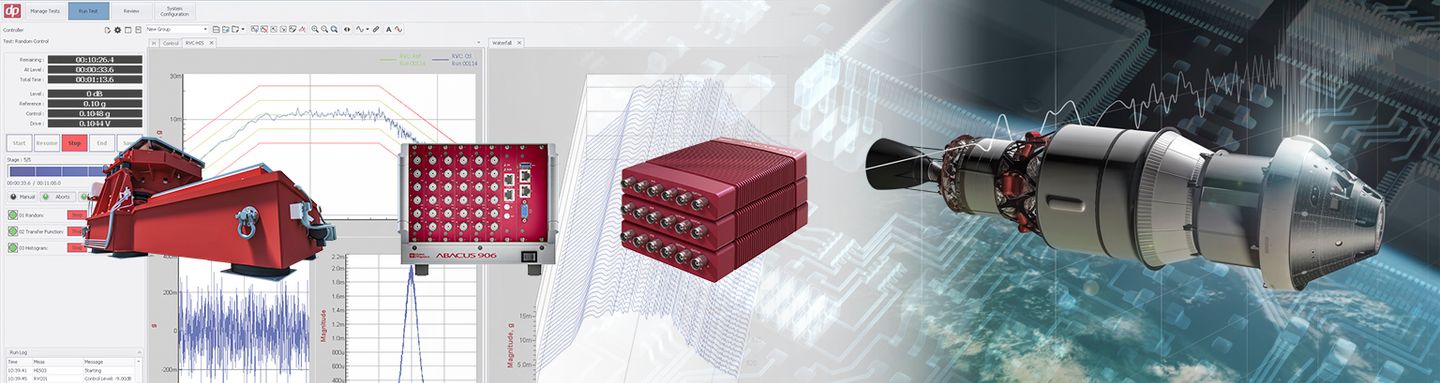
Data Physics - Fast Fourier Transform (FFT) Software
Providing a valuable set of fundamental measurement capabilities, the FFT Dynamic Signal Analysis package with 900 Series hardware delivers a powerful range of functions for fast, accurate, and easy-to-use time and frequency domain measurements.
Waveform capture and storage for each measurement
Complete solution for modal analysis application
Isolation of synchronous content such as with rotating machinery
Octave bands with A,L weighting
Quantified similarity of two signals
Live and averaged spectral measurements in different formats
Minimized spectral leakage as needed for the application
Sine, Random, Burst Random, Swept Sine, Chirp, Pink Noise, and Thump
Resolution of closely spaced frequency components
Comparative visual reference or limit lines
Input, output (DAC), and tach triggers for versatile data capture
Customize data saves and exports to be based on time, frames, averages, or more
Rugged, lightweight, and portable for field applications
Data capture, processing, and storage without a PC
Up to 216 kSamples/sec
Up to 51,200 lines of resolution for Isolation of closely spaced frequency content values
Up to 140 dB for effective measurement of low amplitude signals
All acquired data synchronized to within 0.5deg @ 40kHz even across multiple chassis with thousands of channels
Data sampled, re-sampled, processed, and stored live during acquisition with or without PC
Include readouts including test parameters, customer and test article name, operator, test time, etc
Data from one or more runs/saves can be overlaid in Review Mode within seconds. The overlaid plots can be placed in a report.
Data can be exported automatically during or after a test
Create a report template in Microsoft Word and have SignalCalc 900 populate the report parameters, plots, and images automatically after each test (DP900-68)
Attach images of the test article or setup and have them printed in the report
Generate Reports on the PC that conducted the test, or on any networked PC
Easily monitor signal strength across all channels; green indicates good, yellow indicates low, and red indicates overload.
Export data to Excel/ASCII, Matlab, UFF, ME’scope.
Compare and contrast signals from different Tests/Runs/Saves; construct waterfall plots from individual saves in Review Mode.
Compute velocity or displacement from acceleration, and vice-versa; optional HighPass Filter before Integration is available.
Conveniently increment current graph or all graphs to the next set of channels.
Annotate graphs with important data values; copy all data on the graph or just Peak values to paste into Excel.