
- Home
- Companies
- Hydro Office
- Software
- Durov - Geochemical Data Comprehensive ...
Durov - Geochemical Data Comprehensive Tool Software
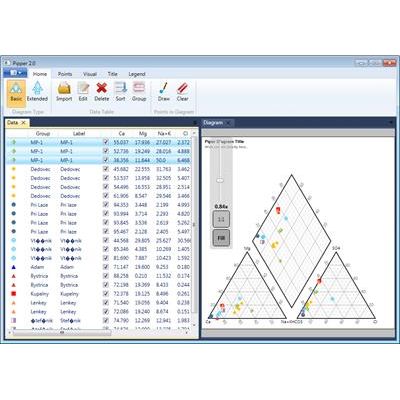
Plot your geochemical data in Durov diagram. Comprehensive tool for creating a professional Durov diagram. The program is based on vector graphic rendering and you can visually edit and adjust all the properties. It also contains many new features you will not find anywhere else. All three diagram-creation programs (Durov, Piper and Ternary) have the same user interface. Therefore, when you master one tool, you can automatically use the other two. The interface is very simple and logically structured so that all features are quickly accessible, and each program consists of a ribbon toolbar and two documents.
The first document tab contains the input data and all visual settings for individual diagram points, while the second presents the actual diagram. All settings can be freely adjusted, automatically or manually, depending on your requirements, and the diagram in the document can be zoomed, scrolled and visually edited (vector graphics).
The diagram can be exported from the program as an image in six formats, and it can be exported in the complete size or you can export only the part currently visible in the document area. All visual settings and imported data with defined point presentation can be exported to a specialized file, and this can then be re-imported into the program at a later stage. Durov diagram can be displayed in a basic form or it can be extended by two other segments.
The input data can be manually entered in the program, or it can be imported in a simple CSV file (columns separated by tabs). When the data is in the program, you can define the visual presentation of every record in the table. Overall, you can choose between 28 types of point presentation when defining your preferred color, transparency, size and type of display. In addition, as shown below, the program allows you to view the image you choose from the disk exactly the way you want it, before you use it.
An additional interesting feature is that you can incorporate extra information in your diagram by point color and size gradient.
Since the diagrams were programmed as vector graphics, it is possible to visually configure all the diagram objects. You can set the background color of all the objects as solid color or can use dynamic linear and radial gradients of two colors. It is also possible to set the external boundary line colors, the legend, title, fonts, font sizes, the visibility of numeric labels and the steps in your grid lines. You can also adjust the diagram title.