

eneida DeepGrid - Version Discovery -Interactive Environment Software
Delivers a rich interactive environment, for Data Exploration, Global States Awareness, Asset Management and Configuration, Reporting and LV Apps utilization. from eneida or 3rd party Apps, for a better understanding and decision making on the new LV Grid.
Make sense of real time and historical data
To provide Neighbourhood Grids with an unprecedented level of understanding of new events and anomalies on the grid, by representing the grid to Al systems as a grid, and not as separate sparse measurements, using all sources of available data
Asset Management
Simple asset search, filtering and selection, along with visualisation of all system devices information: type, serial number, associated substation, working modes and last communication.
Event analysis and issue resolution
Event browsing made easy through event classification according to type and severity. Filtering of events can also be made through operational field area, state and time window. Event status can be updated and issue can be annotated -further enriching future Al applications, in particular for intelligent fault management.
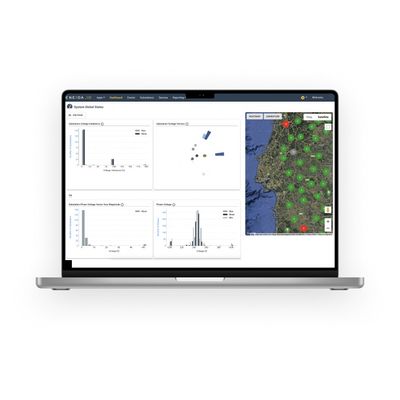
At a glance Global States
Combined GIS heat map and customised data views, allows a first fast grasp of LV grid status, with ability to drill down into specifics such as utilisation visibility, current unbalance, neutral current, voltage, THD, and PV injection.
Customised Situational Awareness
Events and anomalies can be filtered according to type, severity and state, providing each user with their own preferences as to where and what matters most now and into the future, tailored to their particular needs.
Ala Carte Reporting
A myriad of visualisation and frequency of reports and views are made possible for each user or group of users, drawn from eneida`s smart sensors or that of 3rd parties.
Rank, Drill-Down, and Forecast
Rank Substations by Occupation, Identify Top 10 substations, Overload & Overcurrent Duration, Largest Overcurrent Value, Largest Period in Overcurrent, Rank Substations with most PV Injection, Trace evolution of PV Injection and Forecast, among many other analysis options.