

Environmental Data Management Platform
Built for scientists, engineers, and consultants.
Integrated with a network of sensors, our environmental intelligence cloud platform unlocks knowledge to help scientists, engineers, and consultants make the most of opportunities and protect what matters.
With no license keys to manage, and available on any device, our cloud-based platform makes it easy to manage a portfolio of clients, projects and time-series data assets from one intuitive interface.
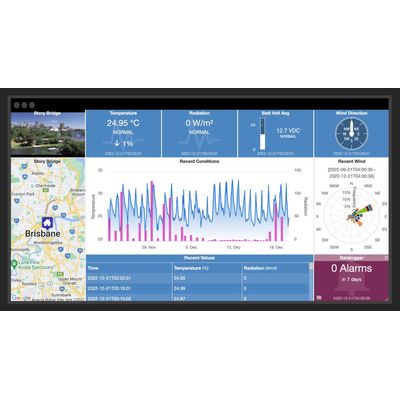
Transform raw data into valuable insights. Our streaming analytics and real-time charting module make it easy to get a clear picture at a glance.
Know what’s happening in real-time, and be alerted to events as they unfold – helping you take timely action.
Our flexible API enables you to integrate publicly available data sources from governments and organizations to enrich your monitoring programs, enhance your insights, and share data with your systems, databases, and teams.
Context menus provide quick access to all functionality and user operations.
Create, move, copy, paste, rename, configure or remove assets directly from the tree. All operations are performed using the same interface – no complex backend system to configure or specialized knowledge required.
Field staff can add and configure new data loggers directly from a phone or tablet without the need for additional support staff.
The images are displayed in the interface instantly. Use the built-in media gallery to quickly review all images or download the original images if you have permission. Set limits and expiry time on incoming images for automatic cleanup.
Associate your camera with a location and view the latest image directly from the map. If the image contains geo-tag data it can be used to automatically update the map marker coordinates.
Trigger an alarm or notification if no new images have been received within a user defined period.
Create a personalized appearance for your company. Upload your own company logos, graphics and text which are displayed in the user interface and emails. All accounts receive a free eagle.io sub-domain. We also offer the ability to use your own custom domain
Create unlimited custom views of your data in visually appealing layouts using animated gauges, charts, lists, maps and images. Resize individual tiles or drag and drop to reposition. Customize individual tiles including setting background color, text labels, alarm functionality and specific properties such as chart duration, map style and zoom, etc.
The dashboard layout is automatically adjusted to best suit your display device so it remains highly useable on smaller devices such as phones and tablets.
Choose to export the raw data or use the built-in historic aggregates to process the data and generate advanced statistical reports. eg. Rainfall monthly totals and maximum flow rates, etc.
Exporting occurs in the background so you can continue to use the system as normal or export additional data as required. When the exported data is ready, an export message is displayed to the user containing a secure link to the download.
Quickly export historic data for a single parameter, a selection of parameters or all parameters in your network. Output your data in a fully customizable delimited text format.
Remove spikes, offset values, apply quality codes, annotate significant events – you finally have the complete data lifecycle in one platform.
eagle.io supports the following types of data loggers:
- Campbell Scientific PakBus loggers including the CR200, CR300, CR800, CR1000, CR3000 and CR6 series
- E State Automation loggers including the
- CellVisor 3000/6000 series
- Halytech Spider SMS and microSpider range
- Libelium Waspmote and Plug & Sense! range with support for Direct Connect or Meshlium
- Metasphere Point Orange 3G RTUs
- OTT netDL 500 and 1000
- Thermo Fisher Scientific dataTaker DT80 range
- Xylem WaterLog Storm3 series
- YDOC ML-315 range
- Dataforth MAQ®20
- Generic support for virtually any data logger that can Email or FTP data in CSV format
Securely store related documents in the cloud. Documents can be files of any type – including spreadsheets, reports, programs, images, etc.
Use the Workspaces Menu to organize your documents and manage user access. The built-in media gallery can be used to quickly preview images or supported video clips.
Documents can be uploaded manually from the user interface via drag-drop or the upload can be automated via Email and FTP.
The event logs provide a detailed audit trail of every user interaction, update, alarm or operation that has occurred in the system.
Review the event logs to check when users have logged-in, changed configuration, controlled parameters, acknowledged alarms or received notifications. Change to Debug level to diagnose connection problems, or drill-down on specific assets to review their entire event history.
Events are categorized into Acquisition, Configuration, State, Notification, Control and Security.
Track your assets virtually anywhere in the world in real-time.
GPS coordinate data can be automatically acquired from data loggers, text files or via the HTTP API.
Display GPS history on the interactive map and configure alarms to send notifications when assets move outside of boundaries.
GPS history and location-based alarming coming soon.
HTTP API
Integrated instant messaging enables authorized users to broadcast messages to all users of a Workspace. Keep staff informed of maintenance schedules, announcements or critical information related to your assets.
We focus on what matters, working to set the standard for the industry, and build capacity across the sector. By highlighting the difference the smart use of time series data can make, and enabling people to make the most of the resources available to them, we lead the way.