

Esri - Maps for Office
Map-Enable Your Data; Making a dynamic map of your Excel data is as easy as creating a graph or chart. Quickly map locations and other geographic data by territory, state or ZIP Code. You control how the maps are styled, so you can emphasize the information that`s important.
Enrich Your Data
Add geographic data enrichment services to your map to get more context about a location or area. Show demographics and lifestyle data and other relevant characteristics associated with a specific area to provide new and deeper insights about your mapped locations.

Visualize Your Data
- Without leaving the Excel environment, make dynamic maps that visualize your data effectively.
- Color-coded maps of your sales by ZIP code. Watch a short video. [00:45]
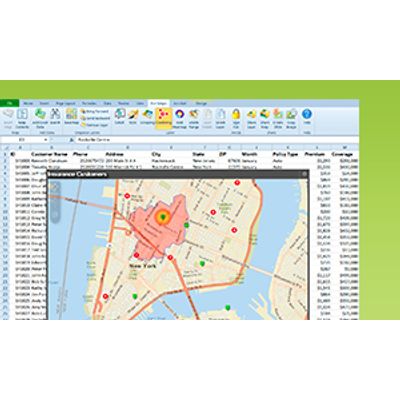
- Point maps to show your customer locations. Watch a short video. [00:45]
- Clustered point maps to group features within a certain distance of each other. Watch a short video. [00:29]
- Heat maps to show the density of point features. Watch a short video. [00:30]

Share Your Maps
With a single click add any map you create in Excel as a slide to your PowerPoint presentation, copy and paste the map into your documents, or share your map in ArcGIS Online. Esri Maps for Office is available in Arabic, Chinese (Simplified Han), French, German, Italian, Japanese, Portuguese (Brazil), Spanish, and Russian.
