

- Home
- Companies
- Eyasco, Inc.
- Software
- Eyasco - Version SiteHawk - Easily ...
Eyasco - Version SiteHawk -Easily Visualize and Access Data Online System
SiteHawk is an advanced web-based system for visualizing and accessing remote data from QuB monitoring stations. It leverages the analytics capabilities of Merlin to provide detailed insights into field stations, making it ideal for observing environmental or infrastructure metrics. The system includes features like real-time geographic mapping of sensor activity, graphing tools for exploring large datasets, and the capability to view recent data trends. Additionally, it supports creating customized reports and data sets for thorough analysis. SiteHawk displays data organized by projects, stations, and sensors, and allows for user-specific credential management. Its flexibility is further enhanced by compatibility with a wide range of data sources and customizable home pages. This makes it a versatile tool for engineers, environmental scientists, and infrastructure managers seeking efficient monitoring and detailed analytics for decision-making and planning.
Using SiteHawk, you will quickly get the big picture overview, captured from remote networked QuB monitoring stations, with Merlins powerful analytics, to better understand the situation in the field and take necessary action.
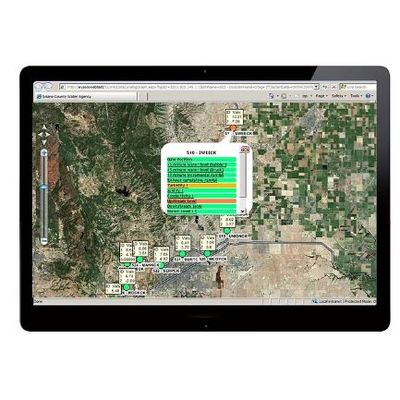
SiteHawks online access provides the flexibility you need. Using a web browser from any location, SiteHawk first displays a map of sensor types operating at all monitoring stations so they are easily identifiable. A simple mouse roll-over drills down into your monitoring station to display graphs charted from the most recent sensor data collected, so you can instantly see the status of your monitoring stations, identify trends or problems occurring at any location, and take immediate steps to mitigate potentially harmful situations or manage for longer term planning.
- Powerful and fast graphing and reporting.
- Data organized by Project/Station/Sensor.
- Wide range of tools for visualizing and reporting large data sets.
- Displays manual readings and data annotations on charts.
- Credential Manager for assigning access to specific datasets and tools.
- Home page and menus are customizable for specific users.
- Easily create html Infopages for fast sharing of data and charts.
- Create your own datasets for analysis and reporting.
- Works with data collected from almost any data source.