
GDM Solutions, Inc.
GDM - Version TDCx -ARM Tablet Data Collector Software
The ARM Tablet Data Collector (TDCx) add-in is designed to efficiently record all trial information at the trial location directly into the actual ARM trial. TDCx is built to improve the efficiency and quality of assessments. This add-in is for: An activated ARM license serial number - TDCx installs onto the same computer as ARM that is installed on one touch-enabled Windows tablet or laptop of your choice (the "x" in TDCx).
Most popular related searches
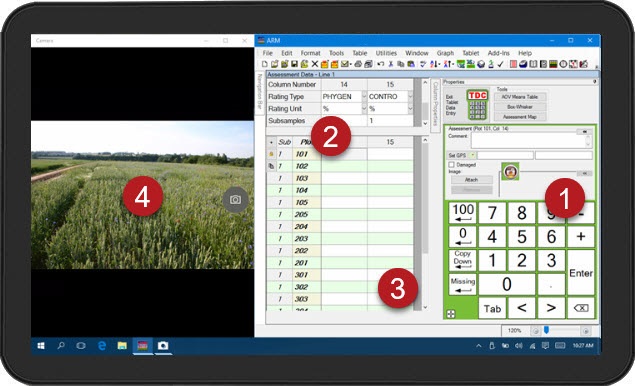
Software display optimized for collecting assessment data
- Includes integrated touch number keypad.
- Pinch-to-zoom for improved visibility in bright sunlight.
- Simplified assessment header and plot description.
- Automatically launch and align Windows Camera app beside ARM to take pictures.
Assessments are more than just a number
- Record GPS coordinates at the plot or trial level.
- Take pictures of each plot for further documentation.
- Mark a plot as damaged, to exclude from analysis.
- Add comments to a plot for further explanation.
Collect data more efficiently
- One-touch shortcut keys to enter 100, 0, mark missing data, or copy down the same value as above.
- Single key press to enter 1-digit assessment scale values (0-9).
- Set cursor order so pressing Enter moves to the next logical assessment data entry cell (across multiple columns or down a single column).
- Collect and enter all supported trial information at the trial site, directly into the ARM trial.
- Save time by taking pictures with the built-in camera, instead of spending hours sorting and manually renaming pictures.
- Copies image file to trial folder.
- Automatically renames picture files to associate with trial, treatment, plot, and assessment date.
- Attaches image to the current plot in ARM.
- Reduce transcription errors, as data is entered directly into the ARM trial.
- Checks for out-of-range entries when data limits are defined (e.g. 0-100%).
- Review data quality while still on-site.
- Check for outliers from the Column Properties panel.
- View `heat map` of assessment values for spatial effects.
- Generate a box-whisker graph to review treatment variance.
- Then inspect data for human error, mark the plot as damaged, and document with comments and pictures of applicable plots for future justification.
- Take photos to document subjective assessments (e.g. rating 1-10) for later review and documentation.