- Home
- Companies
- Itech 515, SL
- Software
- Itech - Version Plantvalue - Real Time ...
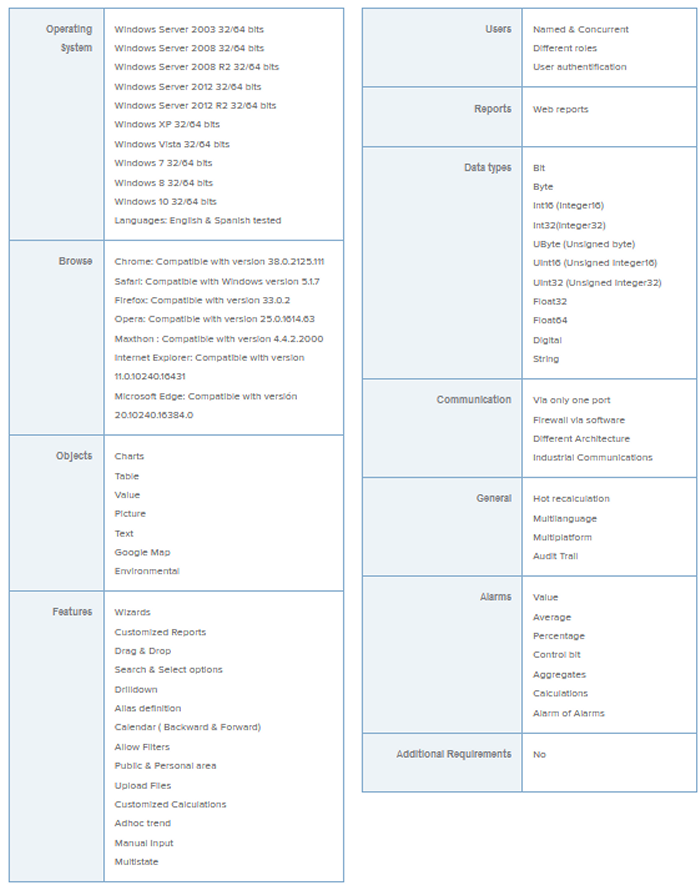
Itech - Version Plantvalue -Real Time Data Acquisition System for Process Control
PlantValue is an industrial software solution that allows you to historicise plant data intelligently, and it satisfies your viewing and diagnosis needs in a quick and intuitive way.
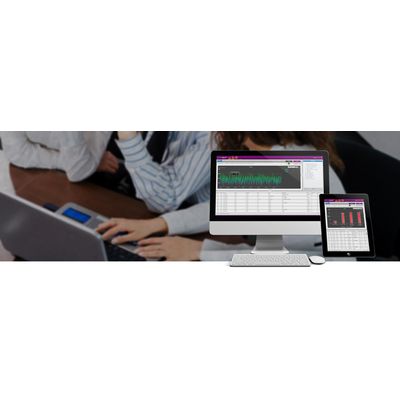
Our goal is to provide effective information and dashboards for data management. The data sample viewed from different approaches (Dashboard) and the ability to go into details (Drilldown) enables intelligent decision making. We provide value added viewing from any device and reading more 10,000 tags per second with the most standard market interfaces.
The worse the economic situation, the greater the need to evaluate. That is why the challenges and opportunities are determined by present decisions. Its fast return on investment (ROI) allows you to have this custom solution for analysis and reporting.
KPI follow theSMARTacronym, which helps in their selection process:
- Specific
- Measurable
- Achievable
- Realistic
- Timely
Standard tools are often used for the exploitation of data pertaining only to specific levels. For example, in which system can we see the data of the last calibration of an analyzer? PlantValue is an alternative to the costly integration of field data in non-production environments.
Cost reduction
Better control of plant information and manufacturing processes without leaving your chair
Flexible information
Make management and operational decisions on any device
Easy implementation
Save money on products and engineering. Its design will allow you to examine the data on the determined dates and conditions.
Simplified reporting
Reduce your questions, divide up and solve your problems easily (divide and conquer !!!) using dashboards
Make it work for you
Let the system do real time control in order to fulfill your environmental issues ( emissions, air quality and waste water), reporting to the environmental authorities.
Incremental
An interface for each data source. Integrate your data in a single platform.
A different access is assigned to every asset of the system in order for you to choose what information is to be viewed by each user. You can also select the screens and the reports that a designated user is allowed to view. Furthermore you can name your elements with an alias.
Choose the screens and the person you want to share the screens with: customers, colleagues or anyone else. It is as easy as to press a button and to decide the expiration date of the access. Do you know that it is actually as simple as to pass him/her the URL that the system will assign to you?
Make complete or scalable copies, but the important thing is that you do not miss any data of the system. Automate the management of the copies and enjoy the data whenever you need them.
Do not just use default templates. Make your own reports by means of an Excel Add In which allows you to manage your information easily whenever you want.
Use only your browser for your data processing, that is all you need. You can even run the reports that you have already prepared in Excel through the Web without any previous installation. Do you want them in Excel or in PDF?
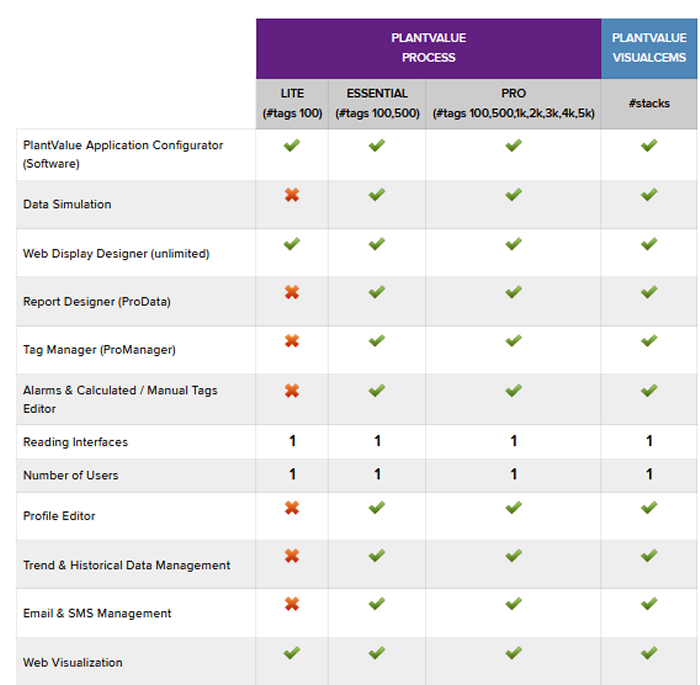
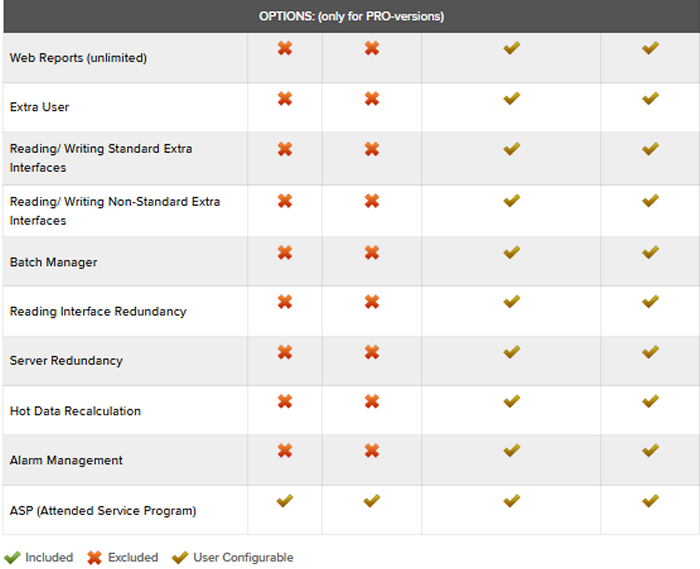
The professional version allows you to adjust the solution to your needs. Start with a name user and 100 tags and add more functionalities later on. Did your boss request you a KPI screen for him ? Enhance your decisiveness by sending him in 10minutes a link to view it.
Did you miss an alarm or an aggregator or for instance a calculation of the maximum value in a day? Did you program something wrong? Have you ever had a request to do a calculation based upon historic data? You can make a quick recalculation up from selected data and build all the data again while proceeding with the ordinary performance of the system What happens with the alarms and other already existing calculations? The system will restore them again so that any already existing data won’t be missed.
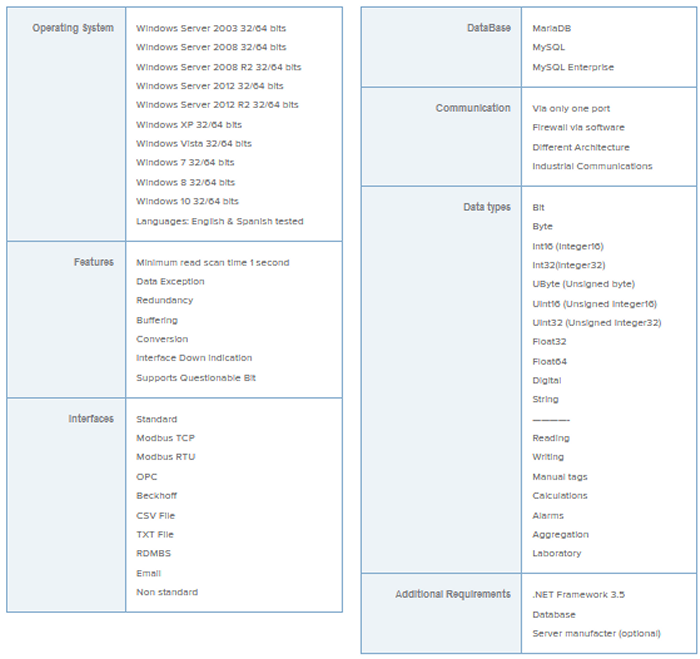
There are many protocols in the industrial environment like:
- OPC
- Modbus RTU
- Modbus TCP
- Signals 4 20mA
- text files
- …
which one do you need ?
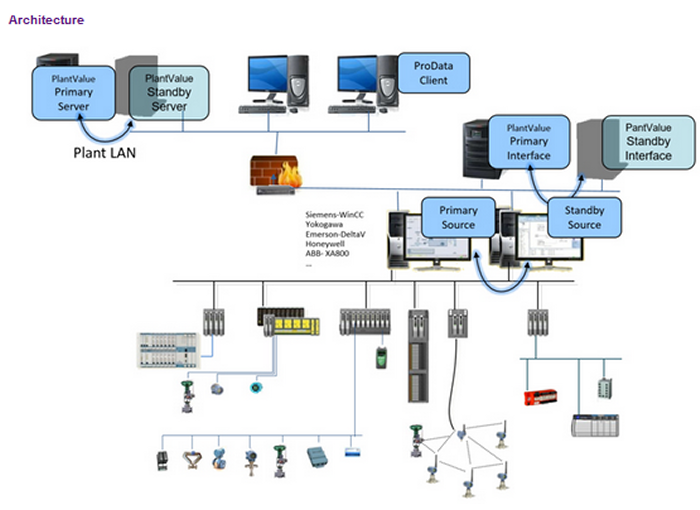
Communication interfaces are redundant as the server. Thus, there is no need for you to worry about any software failure. We take care of the availability of the data so that you can focus your attention on the information provided by the system and in this way, be able to boost your efficiency.
Do you know how many alarms had occured during a day o during a period of time ?
According to the EEMUA 191 and ISA 18.2, the average maximum acceptable rate is 150 alarms per day. The problem is that it is not possible to manage an average of 10 alarms every 10 minutes. What is the ratio allowed by your system? Use the drag and drop tool in order to know how to improve the quality of your alarms.
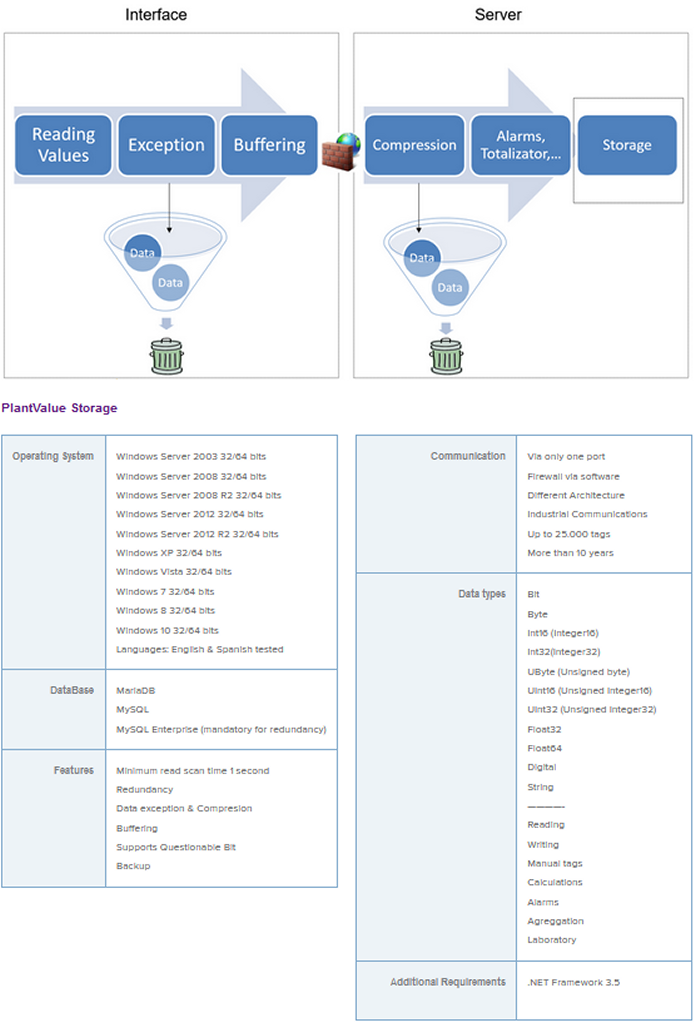
In situ solutions inside a demanding environment must be secure and robust. In ITECH515 we are clear-headed: data must pass through the filters of the most demanding security systems. Therefore, all the information goes through a unique port so that security measures like a firewall and other control tools are able to be introduced.
The Exception and Compression systems which have been developed together with the Mathematic Department of Rovira i Virgili University URV allow us to guarantee that only the most significant information will be transferred from the original source to the final server to be stored there.
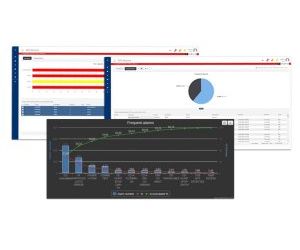
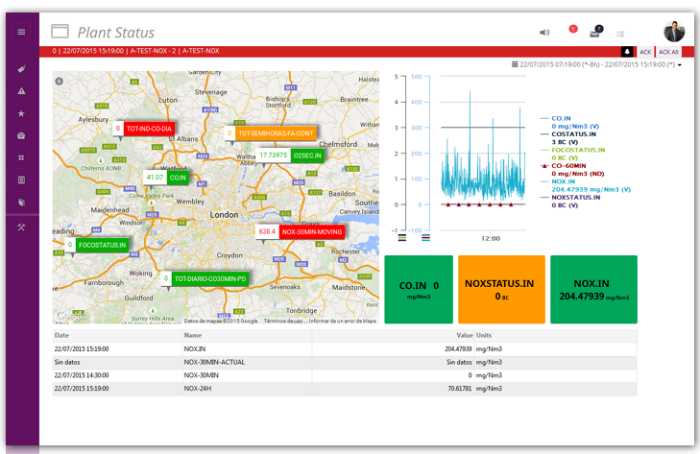
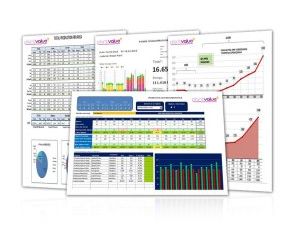
Dashboards are diagnostic tools that let you read the key operations of the plant and get deep information if necessary.
The visual representation of a board helps to better understand the cause of poor performance. It provides managers with an overview of business performance, and each responsible party can have a view. A good dashboard design is key to support the achievement of objectives and an analysis of key processes.
We often need to control the following aspects:
- Set a period of analysis and review their values (e.g. have the last 30 minutes of point values of pressure and flow rate for process control)
- Providing periods of rest, operation, preventive maintenance, corrective maintenance or unavailability through codes with programmable colors and a choice of date range.
- Alarm Control by KPI. How many alarms have appeared during a shift? We have had avalanche (more than 10 alarms in 10 minutes), Ratio of alarms per day, per hour, most frequent alarms, etc. in accordance with regulation ISA 18.2
- Control over which parts of the plant do not work correctly by assigning control bits that identify different states.
Dashboards, both strategic and corporate, allow online parameterization in each functional area. We can also target each level of responsibility, so that we always harbor the minimum, necessary and sufficient information to draw conclusions and make the right decisions.
One can not forget the importance of graphs, charts and/or alarms etc., because they are true support links to all the information summarized in the different dashboards.
Flexible reports with ProData
Exploiting data in real-time allows you to make decisions in industrial processes.
ProData is an Excel complement and is designed to meet reporting needs. Microsoft is a standard platform standardized by most companies so it is very easy to get used to. Excel is also the most powerful, flexible and most used software in the world . No other program can compete with it in terms of features or flexibility. It is true that there are functions on the internet to get data, but ProData allows for the configuration of reports and templates based on different customer needs.
We are going to make your life easier
Companies use more and more complex systems to obtain the data they need in order to evaluate their productivity. But not everybody has the same possibilities. You can create for yourself, or have someone create for you, a template that you can understand and which returns the information you expect to receive. Run it whenever you want from your Excel program or upload it to the web so that you or your colleagues can share it and run it as often as you want. That easy, that simple.
Are you tired of trying new software?
As an automation team, we have downloaded hundreds of programmes that seemed to provide a solution to our questions. Many of them fall under the BI category (Business Intelligence). These are offered as free platforms but they make you carry out the development in accordance with all the calculations; this is not a very practical solution.
ProData retakes the concept of simplicity. It is fast, easy and comfortable. You do not need to ask questions to your colleagues or check their notes. It is a simple but robust graphical interface which allows you to set parameters for the information you need.
Do I require Microsoft Excel to view my results?
Microsoft Excel only needs to be installed on the server. Via your browser, you will be able to call out the reports you prepared previously selecting a new time period; in just a few seconds, you will get your results in PDF or Excel format. With no other requirements. With no other tricks. With no other complications. You will be able to analyse, in a fast and easy manner, all the assets of your company from any peripheral device, just using your favourite browser.
Give yourself the chance to enjoy technology and the Internet revolution to diagnose ‘hot spots’, flow meters which do not give the correct measurements, pressure and temperature levels, water condition, laboratory results, motor maintenance periods, actions by month, PID evolution…
Attach a report before and after an event for the people you deem necessary. This is what facilitating and enjoying industrial software means. Are you still one of those people who access the system to check the status of your assets? We would like to invite you to practice the ‘No news, good news’ philosophy.
There are still islands in companies where it is not possible to monitor data in a centralised manner. PlantValue provides an adequate industrial connectivity solution for every need and combines in a single platform.
The interfaces are read/write drivers that enable communication with our data sources. There are currently various protocols implemented, according to the different communication needs of our customers (OPC, Modbus TCP, Modbus RTU, hardwired signals, RDBMS , manual Laboratory data implementation (Excel) and text files, etc.
If you cannot find your driver we are committed to do it at no additional cost.
Our mission is to maintain the quality of information and provide an easy, convenient and useful operating system to the user system.
The main attributes of the data are:
- Precision
- Consistency
- Integrity
- Validity
The process of data integration involves the movement of data from different sources stored in unified data bases.
PlantValue allows the customisation of the data in reading time and individual accuracy to give a personalised solution to each element. In this way we can manage thousands of tags per unit time.
Alarm Control System
Alarm processing in real time allows to solve problems in a production plant.
It is essential to bear in mind that whenever the capacity of answering of an operator is exceeded, some alarms will be dismissed. Therefore if it is not possible to prevent some important alarms from being dismissed , this may lead to a serious accident.
Following professionals are likely to require this service:
- Instrumental Operators
- Electrical Operators
- Head of Departments
- Technical Control Department
- Environmental Department
- Security Department
- Quality Department
Therefore, KPI´s alarms screen allows and helps:
- To develop, take and maintain an alarm philosophy in order to establish the criteria for their right implementation and modification.
- To gather data of the Alarm System and create a reference point in order to compare and to be able to do an alarm test.
- To solve the most recurrent alarms: Experience shows that a reduced group of recurrent alarms use to cause a high average of the total load. This correlation is pointed out when just 10 alarms cause a 20% or 80% increase in the total load of the system. Thus, it is convenient to correct them in time once they have been detected.
- Knowledge, classification and documentation of the alarms: It consists of reviewing all alarms, their configuration as well as their function in order for them to comply with the philosophy developed at the first point. It is a work which may require a high investment in terms of cost and time. The documentation of the alarms is an essential requirement to make the Master Database for it collects all the updated information ( configurations, settings, priorities, etc ) of each alarm of the system.
- To install the Alarm Management in real time.
- To control and maintain the system improvements: The processes and systems as well as the sensors in any plant are subject to changes as time goes by. Because of this, alarms performance will be updated according to those changes. Alarms which perform properly at present, may become troublesome or perform inappropiately in the future.