

Kamstrup - Leak Detector Software
With Leak Detector, you will be capable of the following: Find possible leaks in your service connections and distribution mains. Reduce your amount of non-revenue water. Utilize Leak Detector’s dashboard and built-in algorithms to prioritize your resources better. Get a map-based overview of your distribution network to conduct more in-depth analysis of your network. Get in touch for a discussion about how Leak Detector can analyze your data and create transparency in your distribution network.
Leak detection is often a both complex, time consuming and expensive task for many utilities – especially in service connections. With acoustic noise data from your water meters, you can target your efforts and optimize your leak detection efforts. The newest generation of Leak Detector offers an ntuitive visualization and analysis of noise data from flowIQ® 2200 water meters. Based on an advanced algorithm, the system identifies the meters with the highest risk of leakage so that you can spend your time verifying and fixing leaks rather than searching blindly to find them.
With a faster and more efficient leak detection, you reduce your cost per identified leak and can find the low-hanging fruits for reducing your Non-Revenue Water. Detailed knowledge about high risk installations with possible leaks and the overall condition of your network will also enable you to prioritize your daily efforts to when and where they will have the biggest impact
Identifying high-risk installations
Leak Detector makes it easy to target your leak detection efforts. Based on an advanced algorithm, the system automatically interprets the noise data over time and identifies the meters with the highest risk f leakage. This lets you spend more time in the field verifying potential leaks while the system handles the task of monitoring your distribution network.
You can also create your own analysis based on filtering options, intuitive color coding and noise curves that gives you an overview of the noise registered by each meter.
Visualization of noise data
As you select one or more meters on the map, graphs let you look into the noise development. This enables you take action as soon as the noise reaches a critical level and helps you distinguish noise from circulation pumps and more with noise from actual leaks.
You can also correlate noise data from several meters to look for similarities which can indicate a leak on a distribution main.
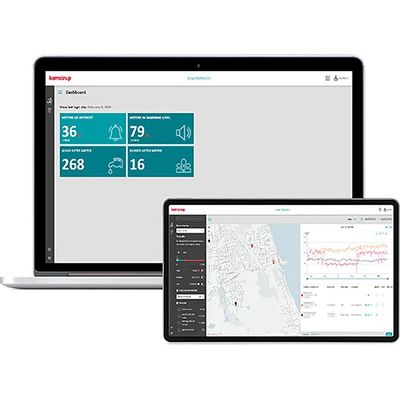
Stay up to date
Get a quick summary of the most important findings in Leak Detector’s dashboard or set up automated reports on meters with elevated noise levels or unusual developments that requires your attention.
You can also store information on confirmed leaks or other noise sources in Leak Detector for future reference. This information will then anonymously be used by Kamstrup’s data scientists to optimize Leak Detector’s algorithm and make it even more effective.