

- Home
- Companies
- KISTERS AG
- Software
- Kisters - Environmental Cloud Data Hub ...
Kisters - Environmental Cloud Data Hub Software
Environmental intelligence, connected and simplified in an intuitive and flexible, cloud-based platform. KISTERS datasphere brings past, present, and forecasted data from multiple sources into one intuitive cloud platform — so you can see more, understand faster, act with confidence. Track water levels. Monitor sensor networks. Compare sites. No coding. No installs. No rigid tools. No paying for modules you do not need. Just smart insights — from day one, and ready to grow with you.
Unlike other platforms, Datasphere isn’t limited to a specific niche. Its data-agnostic design allows integration of any data type. Bring together sensor feeds, third-party data, and forecast layers.
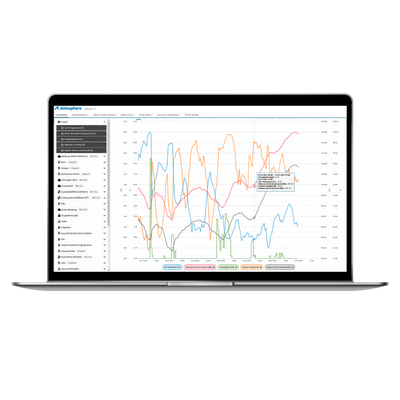
Go beyond line graphs. Use comparative, real-time, and customisable visualisation tools— from GIS map views and dashboards, to forecast overlays and trend analysis. Get station-level access, overlay multiple data series in a single graph (i.e. rainfall data with level data, or forecast data with sensor data) and access recent and historical data all at once.
Logging, reporting, and alerts are fully automated. Set threshold-based alarms and receive notifications via email, SMS, or WhatsApp channels. Built-in red–amber–green indicators show risk levels at a glance, helping teams act early. Whether in the field or office, everyone gets the views they need.
All tools are built for operational teams — no coding needed. Unlock advanced modules only when needed, with no upfront commitment. Set alarms, share data, automate via API, or add forecasting for hail, frost, floods, and more.
Easy setup & user control.
Fast, no-code setup with flexible user management and access controls.
Full data access & smart storage.
Access recent and historical data with centralised storage, plus flexible manual or automated export options.
System health & external data integration.
Monitor device status (battery, signal) and integrate dynamic logging, third-party sources, and basic gridded weather data
Real-time insights & visual alerts.
Use map-based views and color-coded graph alerts to detect issues quickly and make informed decisions.
Custom dashboards & comparisons.
Build personalised dashboards with overlays, visual comparisons, and interactive tools to suit your needs.