The coreVIEWER app serves as the primary interface for core sensing's smart sensors, ensuring seamless integration and user interaction with measurement amplifiers and IoT gateways. Available for free on Google Playstore and Apple App Store, the app provides a user-friendly platform for both configuration and data visualization. It allows users to view various measured variables through graphical tools, and to configure sensor nodes and IoT gateways directly from the app. Moreover, coreVIEWER enables direct saving of measurement data onto smartphones or tablets and supports data export in .csv format. The app remains functional without a Bluetooth connection by utilizing the internal flash memory of the coreLIME or coreIN measurement amplifiers. Its customizable dashboard features include line charts for temporal data comparison, radial and linear gauge charts, number and picture widgets, and interactive button charts, making it a comprehensive tool for monitoring and analyzing sensor data.
The coreVIEWER app is the heart of our IoT sensor platform. It is available free of charge in the Google Playstore or Apple App Store and is intuitive to use. coreVIEWER is the direct interface between the smart sensors and users and makes all measured variables visible via various graphs and tools. In addition, all settings and configurations of the sensor nodes and IoT gateways are made via the app.
Overview of all available sensors
Simultaneous connection with up to 4 sensor nodes
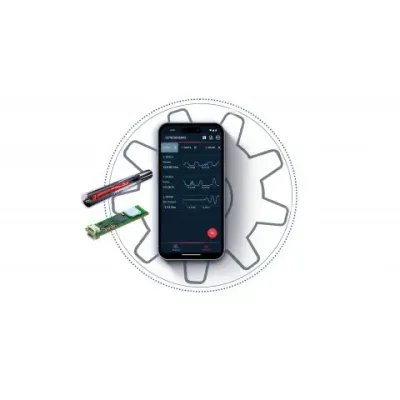
Live display of measurement data
Configuring sensor nodes and gateway
Starting, ending and displaying recordings
Creation of your own dashboards
Setting threshold values and events
By activating logging, the measured values are saved directly to the internal memory of your smartphone / tablet and can be exported as a .csv file. In logging mode, measurement data can also be saved without an existing Bluetooth connection. The internal flash memory of the coreLIME or coreIN measurement amplifier is used for this purpose.
... the sensors and sensor nodes
Defining and changing the names of the sensors/sensor nodes
Taring of measured values
Entering and changing the calibration values
Setting the data rate
Firmware update
... the gateways
Configuration of the analog outputs
Scaling values
Connection rules
Firmware update
Get a quick picture! As soon as you connect a torque or force sensor, all measured variables of a sensory component are clearly displayed in the dashboard, making it easy to keep an eye on the most important measured values of different components. In custom mode, you can display exactly the measured variables that are of particular interest to you - from up to four measuring amplifiers simultaneously.
View as line chart
Live value as digital display
Min/max/average value for adjustable period
Tare
Register change between connected sensors
Planning and starting the recording of measurement data