

- Home
- Companies
- GreenPowerMonitor
- Software
- GPM Plus - Monitoring and Management ...
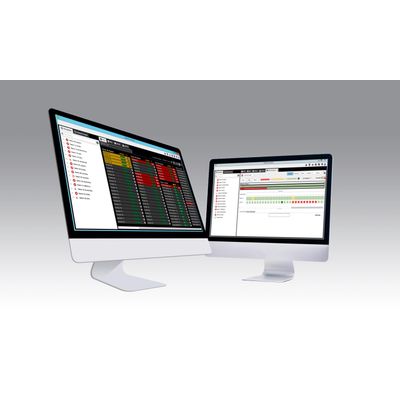
GPM Plus - Monitoring and Management Program
Manage every level of your renewable portfolio in real-time. GPM Plus offers comprehensive resources to manage renewable asset portfolios, including automated reporting, forecasting, maintenance, financial and asset management.
- Real-time monitoring
- Alarms configuration
- Automatic reports
- Business analytics
- Completely scalable
- Customizable tools
- Asset management
- Tracking financial status
- O&M management
- Control room display
Portfolio overviews
Feed your control room with our portfolio dashboards.
Plant dashboards & layout
Manage and monitor your plants through line graphs, SCADA layouts or plant dashboards.
Portfolio alert manager
Manage all portfolio alerts in a comprehensive view that includes critical actionable information directly linked to GPM’s ticketing tool.
Detailed device information
Quickly view the incidences, descriptions and real-time values of each one of your devices.
Custom alarms
Configure plant or device alarms using complex activation and deactivation conditions.
Intelligent alarm evaluation
Scalable management of alarms, inhibiting redundant alarms and highlighting those most priority, even with thousands of alarms configured.
Integrated ticketing system
Activation, notification, maintenance, detailed alarm information and reports.
Preventive maintenance planning
Organize a calendar of preventive tasks, integrated with the ticketing system.
Custom business variables
Add any business-specific variables you require and compare them against a fixed or dynamic goal.
Calculation of losses
Estimate losses for each of your alarms.
Lens control panel
Compare the performance of your assets against daily, monthly, and yearly targets.
Contractual calculations
Label events that are outside your responsibility to be factored into the calculations.
Multiple visualization tools
Visualize any of your variables in tables, scatter line plots or histograms.
Customize the series as required
Change the period, granularity, or calculation type of a series in seconds.
Save and export your queries
Save your queries or export them in editable formats.
Compare KPIs
Freely compare monitored, customized, device or facility variables.
Customize according to your corporate branding
Use your template, colors, labels, and logos in reports.
Send automated reports via email
Generate email reports to recipients as soon as data is available.
Default and/or custom reports
Use our default reports or generate your own with your formulas and requirements.
Reporting maintenance
Complete maintenance and alarm reports.