

NoiseMap Ltd
- Home
- Companies
- NoiseMap Ltd
- Software
- NoiseMap - Industrial Noise Calculation ...
NoiseMap - Industrial Noise Calculation Software
FromNoiseMap Ltd
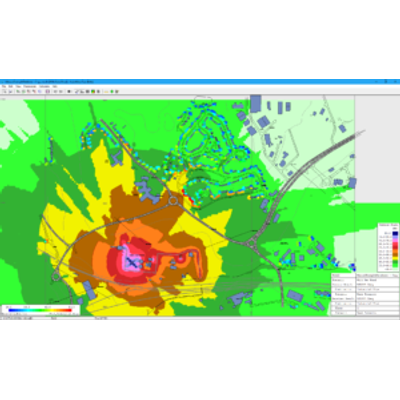
This noise map shows the spread of noise from an industrial site. The coloured areas show how the noise spreads out, with purple areas being the noisiest and pale green being the quietest. The irregular edges of the contour are due to screening by buildings and other structures.
Most popular related searches
industrial noise modeling
noise modeling software
noise modeling
industrial noise
noise mapping
noise software
In the top right of the map, coloured squares show the noise levels on the facades of the buildings.
This map was generated by NoiseMap software, using information on the location of the noise sources and the sound power level of these sources. This map shows the ‘A-weighted’ sound levels, but NoiseMap can also calculate the octave band sound levels which may be needed in specialist assessments.