

Sensofar - Version SensoVIEW -Powerful Analysis Software
SensoVIEW is the ideal analysis software for a broad range of analysis tasks. It includes a comprehensive suite of tools for preliminary examination and analysis of 3D or 2D measurements, allowing roughness or volume calculations and measuring critical dimensions (angles, distances, diameters) with a set of analysis tools.
Simple yet powerful, designed for you
This dynamic software provided with the Sensofar systems offers a complete set of user friendly tools for displaying and analyzing measurements. The user is trained and guided through the 3D environment, delivering a unique user experience: Access to operators in just one-click; icons with eye-catching design; a better function understanding; and simultaneous 3D, 2D and profile views are just some of the key features of the SensoVIEW analysis software.
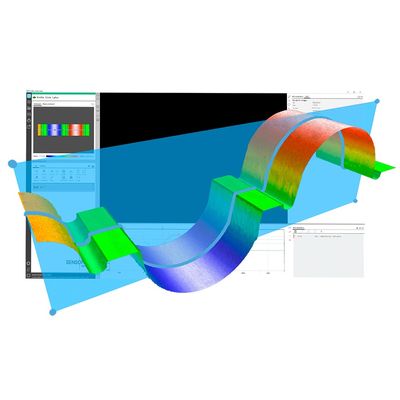
Choose your own view
3D and 2D interactive views provide multiple scaling, display and render options.
Process your data
Full set of operators to process the data information or generate alternative layers.
Interact with analysis tools
Broad range of analysis tools for preliminary examination and analysis of 3D or 2D measurements.
Get your results
Get a customizable report or export the 3D measurement data in multiple formats.
Smart calculations tool for key parameters
SensoVIEW analysis software provides a specific step-guide to get surface texture parameters according to ISO 4287 and 25178 with just one click. It is the easiest way to fulfill with roughness & waviness ISO standards, simplifying the process of analyzing the measurement data.
ISO 4287 calculations
It automatically filters the primary profile according to ISO 4287 and ISO 4288, returning the roughness (Rx) and waviness (Wx) parameters. The calculation of the parameters consists of a set of predefined operators, filters (F-Operator, S- Filter and L- Filter) and additional settings.
ISO 25178 calculations
Designed for users without a deep knowledge of ISO filters, who can now extract this information, by simply selecting the type of surface being analyzed. This operator filters the surface according to ISO 25178, returning the surface texture parameters. The users only have to select its desirable final cut-off.
Watch our ISO 25178 Webinar to learn more.
Surface texture characterization
The ISO 25178: Geometric Product Specifications (GPS) – Surface texture: areal standard is an International Organization for Standardization collection of international standards relating to the analysis of 3D areal surface texture. It is the first international standard that takes into account the specification and measurement of 3D surface texture, and in particular defines 3D surface texture parameters and the associated specification operators.
Surface parameters are calculated according to ISO 25178:
- Height parameters (height values along the Z axis)
- Spatial parameters (spatial periodicity of the data)
- Hybrid parameters: (spatial shape of the data)
- Functional parameters (parameters calculated from the material ratio curve, surface into motifs, valleys and hills)
The most perceptive visualization of your topographies
Image control options are always in continuous development for an excellent fit to all sample types and customer needs. A full range of image processing settings are included in each of the rendering visualizations choices and presented together with scale options for a better adjustment.
Auto-managed rendering views
Five smart visualization modes (false color, stack, stack & false color, true color or directional luminance) are always within reach in the main screen.
Automatic flow settings
Users will be free and able to control different parameters like scale range, Z value, stack, color and shadow settings.
Profile tool
For displaying images and 3D measurements, several profile options are available: horizontal, vertical, circular, top/bottom, free or average profile. The profile data can be analyzed using all the critical dimensions tools.
Customizable reports for more flexible results presentations
With the possibility to choose from different report templates, the user can configure every section to fit as much as possible to their requirements. A flexible way to obtain clear and well-structured reports for each measurement, showing the acquisition information, 3D data, a 2D profile and all the ISO parameters, among others.
3D exportable in multiple formats
Several options are available for managing the output files. When saving a measurement in SensoVIEW analysis software, the raw data is always preserved. The measurement surface data can be exported in *.dat, *.stl, *.pcl, and *.x3p formats.