
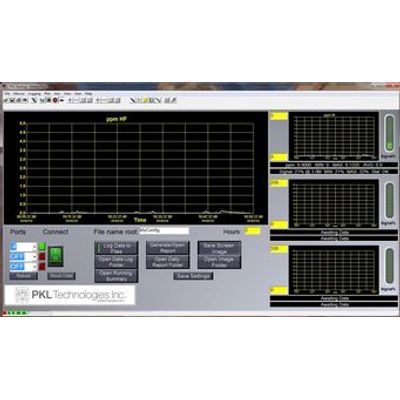
Spectra - Version 1 -Program Software for Data Display and Logging
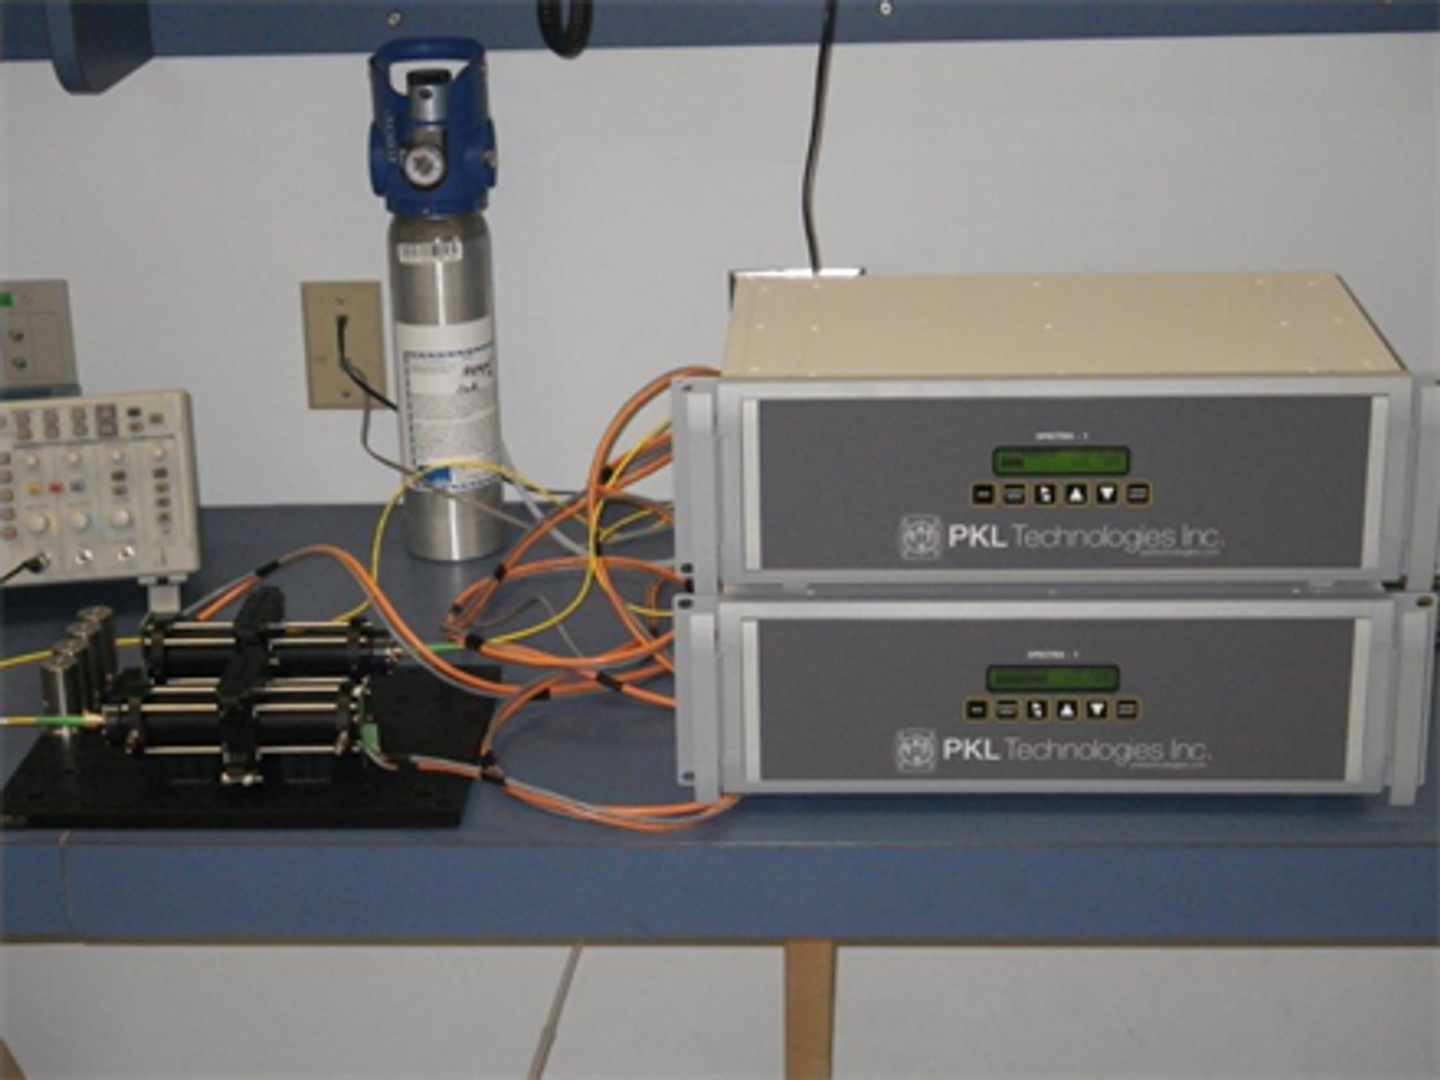
Spectra-1 Extractive gas monitor features the same gas analysis software as used by the open path Spectra-1 monitor. Tuneable Diode Laser Absorption Spectroscopy (TDLAS) based gas sensing. Closed path internal multi-pass sampling cells are used instead of an open path configuration to calculate gas concentrations. 19` rack mounted design. Options include internal sampling pump and 4-20mA output. Standard configurable RS232 data output.
Ports
- The Port Numbers are loaded automatically with available ports OR with the last saved configuration. Clicking Reload will close all connections and reload the available ports in all 3.
- All ports are pre- configured for 9600 8-N-1.
Connect & Indicators
- The Connect button will attempt to open all selected ports.
- Any connections that could not be opened will sound an alarm (bell), keep the indicator red, and log an error to the daily error file contained in the data directory.
- Opened connections will turn the indicators green.
- Arriving data on the respective port will turn the indicator yellow for a moment.
Data Errors
- Data errors, such as framing errors, will turn the indicator red for a moment, sound the bell, and log an entry to the daily error file contained in the data directory.
- After 3 consecutive packet errors, that port`s input is flushed and the unprocessed data for the port is cleared.
Timeout Error
- Should data not arrive within 35 minutes on an open port, the respective plot`s Signal information textbox will turn red (background) and the date/time of the last data will be shown as the message.
- An alarm will sound every 5 seconds.
- Changing/reconnecting to port number will clear the alarm for another 35 minutes. The box will go black again, and arriving data will clear the message.
Reset Data
- Reset Data button will reset the plots, the MIN/MAX/AVG, and reset the start time of data acquisition for the daily report.
Logging
- File name root allows the user to select a root name for the configuration which will be used in all files created. Use no commas, slashes or other non-standard filename characters in the names.
- Log Data to File
1. When ON (Green), raw incoming data will be saved to respective data files.
2. A new summary line of the day`s values will be saved to the running summary within seconds of midnight.
3. A daily text report will be generated and saved within seconds of midnight. The time of starting data collection is reset. The MIN/MAX/AVG is reset for the day. - Open Data Log Folder will open the folder containing the raw data files.
- Open Running Summary will open the line-entry file (#2 above). This file is maintained in the "Reports" folder.
- Generate/Open Report will generate a new text report of tracked data, saved to the "Reports" folder, and opened in NotePad. The time of starting data collection is NOT reset nor are MIN/MAX/AVG.
- Save Screen Image generates a JPG file of the screen as seen (snapshot).
- Open Image Folder opens the snapshots folder for review.
Save Settings
- Save Settings will store to the computer`s registry the current values for port numbers, state of log data button, file name root, hours, and plot Y-min/max settings. These values are reloaded when DataView is re-opened.
Hours
- Selects the number of hours to plot. Enter a value and either TAB off or hit enter.
Plot Y-Values
- Selects the number of Y-axis span to plot. Enter a value and either TAB off or hit enter.
Plots
- Click a plot to show that plot in large-view.
Information Text
- Top text box shows species, concentration values and statistics.
- Bottom shows the signal level, distance (path length), statistics, and status.
- Should the status not be OK (0x00000001), the text will turn red, until OK, then will turn Black.
Other status:
NONE
LOW
HIGH
H/L (erratic - High and low)
FULL (Spectra-1 log full) - This status box is also used for timeout error indication (see above)
- Should the status not be OK (0x00000001), the text will turn red, until OK, then will turn Black.
Signal %
- Graphically shows the signal level with color indicator:
- >90 %, Yellow
- 10% - 90%, Green
- <10%, Red
Plotted Data Discussion
A plot is redrawn when either:
- The DataView window is resized.
- The time reaches the X-maximum, at which point it will shift back 75%
- The time or Y-Axis values are changed.
Due to the time involved to redraw all stored data, only the last 6000 points are kept in memory. This allows a redraw in several seconds. For each reading received, 2 points are saved. Based on this, the total time maintained in memory can be found by (assuming all Specta-1`s are set for same time averaging):
Number of hours = 6000 * averaging time / 2 data points each / 3 units / 60 seconds / 60 minutes.
So, if 3 units send data every 1 second: 6000 x 1s /2 /3 /60 /60 = 0.278 Hours
Or, averaging time x .278 hours (based on 3 units, equal averaging times)
On a plot redraw, this is the maximum time that of old data that will be redrawn