


RocFall - Rockfall Statistical Analysis
RocFall can also assist in determining remedial measures: the material properties of each slope segment can be changed allowing for comparison of results. Information about the kinetic energy and location of impact on a barrier can help determine the capacity, size and location of barriers. RocFall also provides commercial barrier information. Users can define a custom barrier, or select one of the predefined barriers.
Report generation of RocFall results is straightforward. Screen captures can easily be pasted into word processors for fast report writing. Graphs and raw data can be exported to Excel from the right-click menu of any graph.
To assist with determining coefficients of restitution, RocFall includes a large table of coefficients of restitution that was compiled after an extensive literature search. Tables for dynamic friction and rolling friction coefficients, as well as rock density, are also provided.
Rock paths can be filtered. You can right-click on individual paths to select only that path. You can also right-click on a barrier and select, from the many impacts on the barrier, paths that had the highest velocity when they contacted the barrier. The Filter Results dialog provides numerous filtering options.
RocFall allows you to create faster and easier high-quality output. Graphs can be exported to Excel with 1-click and the slope and rock-paths can easily be exported to a DXF file for import into a CAD program. The Drawing toolkit has been improved to include importing of bitmap files, multi-line text-boxes that can be auto-filled with relevant simulation data, axes that can be dragged-and-dropped to show coordinates on a printed page and much more. In addition, the new Page Setup options allow users to completely customize the headers and footers of any RocFall printouts.
Input of slope geometry, material properties and rock locations is straightforward; perform a full analysis in seconds. There are no restrictions on slope geometry - add any number of overhanging sections or barriers at any angle/location on a slope. For each simulation, a comprehensive set of graphs and statistics is generated, allowing users to quickly determine risk and design remedial measures. Add a remedial measure, re-run the simulation and graphs update instantly. The Drawing Toolkit allows importing of bitmap files, and includes multi-line text-boxes that can be auto-filled with data, and axes that can be dragged and dropped to show coordinates. Output of graphs, statistics and raw data is available in a variety of formats.
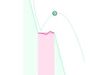
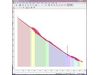
A histogram showing the location of rock endpoints is generated, as well as energy, velocity and bounce height envelopes for the entire slope profile. Distributions of energy, velocity and bounce-height are calculated along the slope profile and can be easily graphed. Statistics are calculated automatically, enabling interactive display of energy and bounce height distributions - so you can quickly determine where these are at a minimum, and place barriers in the optimal location. RocFall 4.0 includes an extensive table of coefficients of restitution (RN, RT) consisting of data from journal articles and field-tested values contributed by other RocFall customers. The software also has a Material Wizard for the back-calculation of RN for any material, based on the location of rock endpoints.
RocFall helps users design remedial measures: the material properties of slope segments can be changed and simulated (e.g. placing loose gravel on a bench) to facilitate results comparison. Graphs and statistical summaries of the kinetic energy and location of impact on a barrier can help determine the capacity, height and location of barriers. Once a measure is applied, a new simulation can be run with one mouse click - graphs automatically reflect the new data. Rock paths can be filtered - right-click on a barrier and select paths with the highest velocity on impact to see where the rocks originated.
RocFall offers high quality graphs and printing. Graphs can be exported to Excel with one-click, and slope and rock-paths can easily be exported to a DXF file for import into a CAD program. Input and output data (formatted in tabular form) and screen captures can be pasted into a word processor or saved to an image file for speedy report writing. RocFall 4.0 also allows raw data to be pasted into a spreadsheet for more detailed analysis (e.g. for determining what fraction of impact locations were above a certain height or for fitting a probability distribution to the data).
Slope
- no restriction on slope geometry (e.g. overhanging sections)
- statistically defined material properties
- rocks can slide, after coming to rest
- statistically define slope vertices
- vary slope angles randomly (i.e. simulate slope roughness)
- import/export material properties
- import DXF, CRSP (version 3 & 4) files
- import BMP images
- Material Wizard to assist back-calculation of coefficients of restitution
Coefficients of Restitution
- table of coefficients of restitution included
Barriers
- unlimited number of barriers
- define barrier response (RN, RT)
- breakable barriers
Rock Starting Location
- specify single location and line seeders
- unlimited number of starting locations
- probability settings for each seeder
- random/pseudo-random number generation
Data Collectors
- gather information/statistics at any location
Filters
- pick particular rock paths to create statistics/graphs
- pick paths graphically or by distinguishing value (e.g. endpoints right of x=43.2)
Graphs
- histogram of rock endpoint locations
- envelope graphs (energy, velocity, bounce height, etc.)
- distribution graphs show distribution at specific locations (same data as envelope graphs)
- create histograms (impact locations, energy, etc.)
- statistics generated for graphs, best fit distribution (normal, beta, triangular, uniform, exponential)
Output
- copy graphs/plots to clipboard
- transfer plots to Excel with one click
- export rock paths to DXF format
- copy geometry/parameters to clipboard
- InfoViewer
- one click gray-scale
- save screen to image file (.bmp, .jpg, .wmf, .emf)
- slope and slope/chart views are easily added to, scaled
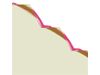
- fill/hatch area below slope to improve presentation
Verification
- extensive verification manual
- detailed hand-calculations also shown
- Slope Stability
- Rockfalls
- Rock
- Mining