
Starpoint Software Inc.
- Home
- Companies
- Starpoint Software Inc.
- Software
- SieveGraph - Version 2.0 - OLE Capable ...
SieveGraph - Version 2.0 -OLE Capable Sieve and Hydrometer Analysis Graphing for Windows
Provides highly customizable, professional quality sieve and hydrometer plots for soils analysis. SieveGraph allows you to produce professional quality, highly customized graphs of sieve and hydrometer analyses.
Most popular related searches
hydrometer analysis
soil classification
hydrometer
particle sizing
soil analysis
geotechnical software
sieve analysis
geotechnical
material testing
- Improved Data Entry -- Spreadsheet-style data entry interface simplifies data input. Enter data as weight retained and percent passing is calculated automatically.
- Improved Clipboard Support -- Data entry is simplified with clipboard support for cut/copy/paste of samples and graph pages.
- Polynomial Curve-Fitting for Lines -- Provides high-quality lines fit to data points with smooth curves.
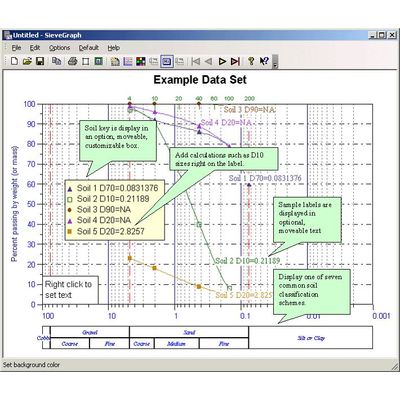
- Calculation of D10 and other size for a given percent -- Calculate the Dx (size at which x percent passes) and easily display on graphs and labels.
- Support for Unicode character sets.
Data Features
- Unlimited number of samples per graph
- Unlimited number of graphs per document (prints one graph per page)
- Import/export of tab-delimited ASCII text files.
- Insert SieveGraph plots into OLE containers such as Word or Excel
- Up to 20 sieve/hydrometer sizes per sample
Customizable Graphs
- Display a text annotation on each graph in a moveable, and customizable text box
- Print graphs with choice or page margins, headers, footers, and graph borders
- Display individual sample labels, or a moveable, customizable legend key, or both
- Set graph text in almost any language
- Plot sieve labels and corresponding sizes at the top of each graph
- Select fonts, colors, and line styles for each graph
- Set maximum and minimum particle sizes for graphs
- Display a unique title for each graph
Usability and Convenience
- Easy-to-use Windows features such as print preview,
- Context-sensitive on-line help
- Extremely easy to use, and very fast program operation
Display a Table of Common Soil Classifications with Each Graph. Choose from:
- Unified Soils Classification System
- Wentworth
- United States Department of Agriculture (USDA)
- U.S Bureau of Public Roads
- American Society for Testing and Materials (ASTM)
- American Association for State Highway and Transportation Officials (AASHTO)
- This is the SieveGraph main window (annotations illustrating features have been added using MS Word)
- You can embed SieveGraph plots in OLE container applications, such as Microsoft Excel (shown here), other Microsoft Office applications, Corel WordPerfect Suite, and many other products
- Here is another sample sieve plot. You have total control over colors and fonts, as well as layout of various items. You set sieve size minimum and maximum. SieveGraph supports full printing and print preview with choice of page margins, headers, footers, and graph borders
- Version 2.0 introduces a simplified data entry interface. Data is entered using spreadsheet style controls. You enter the weight retained on each sieve, and percent passing is calculated automatically.