
Gealog - Standard Software for Windows
Standard software for configuration of Gealog dataloggers, readout of data memory and visualization of data.
For all types of Gealog Data Loggers Visualization of data, setting parameters, evaluation with measured data, remote data transfer, automatic measuring network operation, alarms.
The Gealog for Windows-software can be used for all types of Gealog Data Loggers. It can be used very efficiently for the operation of the dataloggers at site as well as for the operation of complete online measuring networks. It has all functionalities to handle also big networks in fully automated operation. There are different modules for export of data to standard formats and to specific applications. It is running on the operating system Windows. All functions are operated through a Windows-compatible graphical user interface.
The access to measured data or measuring stations is done by double-click on station-symbols. The symbols can be freely arranged on a user defined background picture. Background pictures can be geographical maps, schemes of plants or any other graphics. All graphics can be used which are available in bitmapped format, Meta-format or extended Meta-format or graphics, which are imported by the Windows-Clipboard. (scanned pictures, drawings made by CAD, maps of geographical software etc.) On this background picture the user can arrange symbols to which various functionalities can be assigned. I.g.: On double-click output of a predefined graphic or automatical set-up of a telephone connection to a remote station with readout of measured data.
Get Data:
Read-out of the data memory of the datalogger together with all quality data, parameters and calibration data. The PC reads only the data, which have not yet been stored in the data base locally on PC.
Terminal Emulation:
All operating functions of the datalogger can be controlled via the communication interface. The keyboard of the datalogger is working in parallel to the PCs keyboard, the display in parallel to the PCs monitor.
Transfer Parameters:
The parameters of all measuring stations are stored both in the datalogger and the PC. With this download function it is possible to prepare sets of parameters on PC and download the complete new set to the datalogger.
Get Data from USB Memory Stick:
The Gealog SG datalogger offers the possibility to copy the stored measured values to a USB Memory Stick. These data can be red out quite easily from the Memory Stick onto the PC.
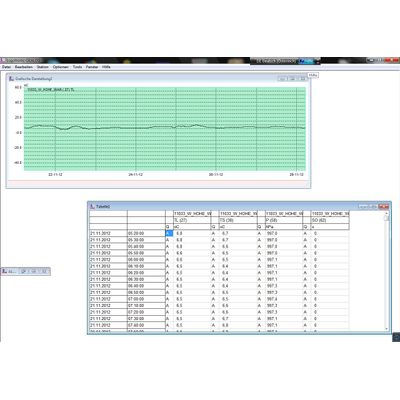
Graphical output:
The stored measuring values can be displayed as time series-graph. Zoom in the time and in the value axis is made by definition of a view-window by mouse. Output can be done as line-graph, as bar-graph or as single points (inspection values). The layout of the graphic can be optimised in different ways (colours, grid lines, labels etc.). Values exceeding threshold values can be marked.
Numerical output:
Display of stored data as table of values with or without the quality tags. Any combination of measuring channels, also channels of different measuring stations can be displayed in one output table.
Several Windows with graphic and table outputs can be opened simultaneously. So a lot of different presentations of the measured data can be produced on the PC´s display. On using “Synchronize Data Views” changes of the displayed time period in one window also changes the presentation in the other windows. All settings for graphic and numeric outputs can be saved into a layout-file and can be used later at any time.
All measuring values of a measuring station are stored assigned to the name of the measuring station defined in the datalogger. Transferred data are automatically assigned to the station name programmed in the datalogger. So there is no possibility to mix up data of different stations by mistake.
Administration of parameter-data, calibration-data and configuration-data: All parameter-data, calibration-data and configuration-data can be predefined and checked on the PC and afterwards downloaded into the datalogger.
- By use of the archive function data can be saved to an archive file and later on retrieved, if necessary.
Data export via the Windows-Clipboard:
As standard in Windows measured values can be marked in the numeric output format and can be copied into the Windows-Clipboard. From the Clipboard the data can be imported into the most Windows-applications like MS-Word, Excel, Access etc.
In addition to the export by the Windows-clipboard there are special export-routines available:
Export as configurable ASCII-file.
Export to the Austrian HZB-Data Transfer Format (Data format of the Austrian Hydrological Service)
Gealog for Windows comprises all functionality for the automatic operation of measuring networks with remote data transfer. The data transfer can be accomplished by PSTN-telephone network, by GSM/GPRS radio-telephone network or by radio data transfer. Also combinations of the above data transfer paths are possible.
Radio Repeaters:
The software supports radio repeater operation up to 5 repeaters between central station and measuring station.
Topology of the network:
The topology, that means “How to access a measuring station” can be defined very easily by a special configuration function (“Topology”).
Manual set-up of a connection:
The functionalities “Get Data”, Terminal Emulation” and “Transfer Parameters” can be used manually by a doubleclick onto the station-symbol.
Automatic operation of the measuring network:
On predefined times the readout of data is done automatically without further user activity. On faults on the data transfer automatic retries are executed. All network-operations are documented in a status-protocol. The readout time period can be changed manually and also automatically depending on incoming alarms. If there are graphical or numerical outputs actually on the screen, they are updated with the new data. Station-symbols can be used for displaying the last recorded measuring value. So “living-pictures” can be produced very easily.
Monitoring of the data transfer lines:
All activities on the data transfer lines are listed in a special protocol window. Errors on the data transfer lines or alarm conditions are visualised by the station symbol by changes in the symbol color or by blinking.
Automatic data export:
After an automatic data transfer the transferred data can be exported automatically to other applications like HIS, flood prediction software, … There are different export possibilities like ASCII-export-files or direct SQL-interface to databases.
Clock synchronization:
The clocks of the measuring stations and the central-PC can be synchronized automatically after each data transfer.
Gealog dataloggers have the ability to send active alarms to the measuring network centre if predefined threshold values are exceeded, if quality tags change their status or also if other criterias are fulfilled.. The Gealog for Windows-software registers alarms in an alarming-protocol and shows alarms on the PC´s display by changing of colours of the assigned symbols.
Alarming by SMS:
Incoming alarms from measuring stations can be forwarded by SMS to the person on duty.
Quit of alarms:
Alarms can be quitted in the network centre selectively or in general.