

- Home
- Companies
- Thermo Fisher Scientific, LIMS & ...
- Software
- Thermo Scientific FreeStyle - Version ...
Thermo Scientific FreeStyle - Version 1.8 SP1 -Data Review Application for Xcalibur Software
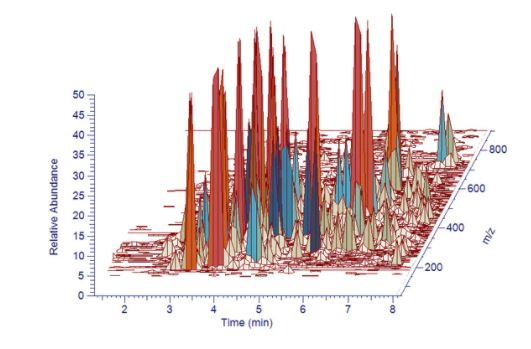
For the qualitative analysis of any mass spectral data (.raw or .sld) in a highly visual environment, FreeStyle allows you to display chromatograms and spectra, detect and integrate chromatographic peaks, search mass spectral libraries, simulate mass spectra, subtract background spectra, apply scan filters, annotate plots with text and graphics, create and save layouts, and view the status of various instrument parameters during data acquisition.
With a familiar interface, the tools needed to access the information stored in your data are readily accessible. HRAM data intelligence means that data is displayed according to the mass accuracy of the MS system used to acquire it.
When it comes to visualizing your data, make use of unlimited plots, quick creation of plots from spectra, spectral annotation with structures, text and graphics, trending/diagnostic plots for status parameters, and scan header entries; float/dock/hide multiple windows and split across monitors to really get the most out of your data.
Create and customize highly visual map views of complex datasets, with simple modification of any plots and data views. Then use those views to generate your own visual reports, enhancing your insights.
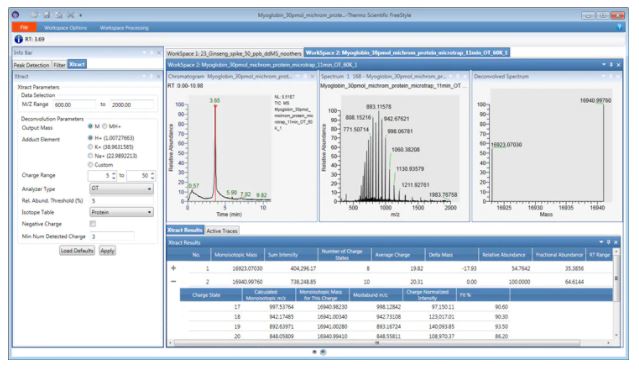
High-resolution protein mass spectral data can be deconvoluted using the Xtract deconvolution algorithm, contained in the Thermo Scientific BioPharma Finder software to obtain the intact mass and a single, deconvoluted mass spectrum for the protein components within the charge state envelope.
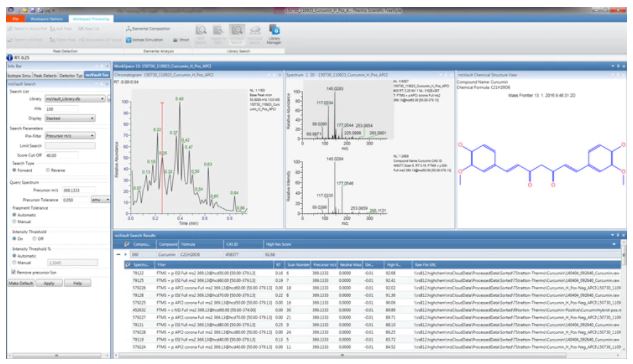
Discovering what is in your data doesn’t need to be challenging. The ability to search the mzCloud mass spectral library, mzVault, or NIST with a single-click means that compound identification from MS and MS2 data is quick and easy. You can also export spectral data to the NIST application.
Elemental compositions can be calculated using MS and MS2 data, with isotopic simulations for added confidence.