PG Instruments Limited
UVWin - Version 6 -Touch Software for UV Visible Spectrophotometers
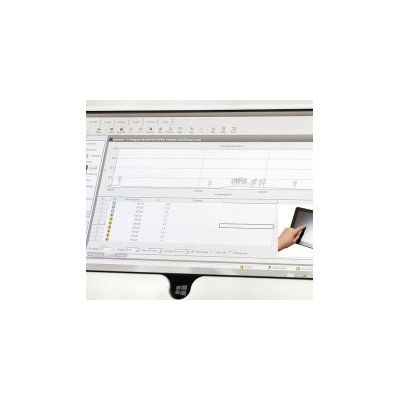
UVWin 6 TOUCH is our latest version of Spectrophotometer Software. The software is designed for FULL control of ALL OUR UV-Visible Spectrophotometers via a Touch Windows Tablet or PC Operating with Microsoft Windows 10. GLP Software is included in UVWin 6 TOUCH.
Most popular related searches
UV-VIS spectrophotometer
UV-VIS
visible spectrophotometer
spectrophotometer
spectral analysis
digital temperature controller
workspace monitoring
photometric analysis
spectrophotometer uv
autosampling
UVWin Touch software is compatible with ALL of our UV-Visible Spectrophotometer – namely T60V, T60UV, T70, T70+, T75, T75+, T80, T80+, T85, T85+, T92+, T110+ and T112+
UVWin TOUCH software is separated into FOUR key workspaces:
- Spectral Analysis
- Quantitative Analysis
- Kinetic Analysis
- Photometric Analysis
Spectral Workspace
- Use the spectrum workspace to scan across a user-defined spectral range measuring in either absorbance or transmission.
- Use the “Peak Pick” tool to determine the wavelength at which peaks and valley have occurred whilst also being able to determine their amplitude
- View spectral overlay in the 3D display mode.
- Perform 1st, 2nd, 3rd and 4th order differentiation on sample scans for Derivative Spectroscopy.
- Export measurement data into Word, Excel, CSV and ASCII formats.
- Create method files for routine analysis whilst also being able to save measurement data.
Quantitative Workspace
- Use the Quantitative workspace to determine the concentration of unknown samples
- Create a calibration curve using a series of standard solution or by directly entering the coefficients for the calibration curve equation.
- Specify 1st, 2nd, 3rd or 4th order correlation for the best calibration curve fit.
- Set Quality Control monitors to take user specified action in the event of measurement results falling outside user defined limits.
- Export measurement data into Word, Excel, CSV and ASCII formats.
- Create method files for routine analysis whilst also being able to save measurement data.
Kinetic Workspace
- Monitor the change of Absorbance or Transmission as a function of time for Enzyme type reactions.
- Use in conjunction with a Flowcell for sample introduction or Peltier water circulator for temperature control.
- Specify data intervals and acquisition time for up to 24 hour reactions.
- Export measurement data into Word, Excel, CSV and ASCII formats.
- Create method files for routine analysis whilst also being able to save measurement data.
Photometric Workspace
- Perform a series of sequential fixed wavelength measurements in either Absorbance or Transmission.
- Automate sample measurements by configuring the instrument cell changer.
- Calculate concentration of unknown samples quickly using the “Simple Calculation” option where complete calibration is not required.
- Automatically calculate statistics like standard deviation, relative standard deviation, and averages.
- Export measurement data into Word, Excel, CSV and ASCII formats.
- Create method files for routine analysis whilst also being able to save measurement data.
Reporting
- Produce reports for photometric, spectrum, kinetic and quantitative measurement data.
- Include or remove spectra, calibration curves along with samples measurement tables.