

- Home
- Companies
- Waterloo Hydrogeologic, PART OF NOVA ...
- Software
- Waterloo Hydrogeologic - Version ...
Waterloo Hydrogeologic - Version AquaChem 14.0 -Water Quality Data Analysis and Reporting Software
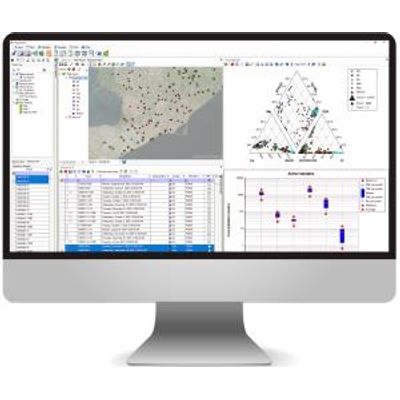
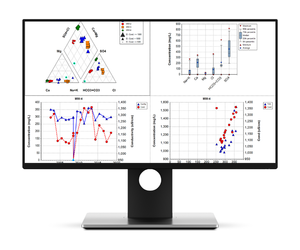
AquaChem’s analysis tools cover a range of functions and calculations including unit transformations, charge balances, and statistics. These powerful analytical capabilities are complemented by an extensive selection of commonly used geochemical plots to represent the chemical characteristics of water quality data.
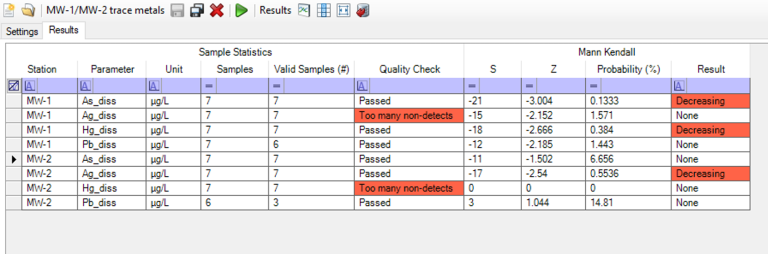
What`s New in AquaChem 14.0Trend Analysis module
The new Trend Analysis module has been added, allowing you to perform statistical analyses on time series data.
- Tests and analyses supported:
- Linear regression
- Sen’s slope estimator
- Spearman rank correlation
- Mann-Kendall test
- Seasonal Mann-Kendall test
- Trend analyses may be exported as spreadsheets or automatically plotted in time series graphs
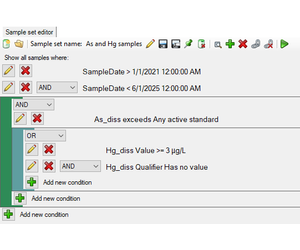
Improved Sample Set Editor
The Sample Set Editor has received a major upgrade in functionality, allowing for more powerful and precise data filters:
- OR statements: Sample set conditions may now be connected with the OR logical operator
- Group conditions: conditions in the sample set editor can now be grouped
- Qualifier field: sample sets can now be conditioned on the qualifier field of the sample result, allowing for non-detects to be easily extracted or excluded
- New conditions: The new parameter conditions “Does not equal,” “Has value,” and “Has no value” have been added
Plotting
Plots have received numerous upgrades:
- Linear regression lines: Linear regression lines may now be automatically calculated and plotted on Scatter and Time Series plots in the Lines tab
- Faster symbology changes: The applied symbol group can now be changed directly from the plot settings window in the new Symbols tab
- Labeled lines: Lines can be given arbitrary labels or take label data from calculated linear regression lines
- Configurable legend locations: The location of the legend can now be customized
- Box-and-Whisker plot improvements: Box-and-Whisker diagrams can now be labeled with the number of samples and non-detects in each data series
Usability improvements
- Modeled and Calculated parameter results may now be exported from the Sample Report module
- Sample analysis result metadata (such as precision, result comments, etc.) may now be exported from the Sample Report module
- Water quality standards may now be exported
- The Sample Analysis Viewer module is now sortable
- Newly-created parameters can now be updated from the Parameter Calculator by default
- Assigning values to DateTime data in tables and in the Sample Set Editor is now easier
- Durov/Piper diagram titles no longer list all parameters by default
- View the enhancements released in AquaChem 13.0 feature sheet
- View the enhancements released in AquaChem 12.0 feature sheet
- For complete version history, see the AquaChem readme file
AquaChem’s analysis tools cover a range of functions and calculations including unit transformations, charge balances, and statistics. These powerful analytical capabilities are complemented by an extensive selection of commonly used geochemical plots to represent the chemical characteristics of water quality data.
- Simple and easy analysis of water quality data
- Effortless and flexible data importing and exporting
- Over 20 essential geochemical plots and graphing techniques including piper, schoeller, scatter, box and whisker, stiff
- Automatic geochemical calculations of water type, sum of anions, sum of cations, ion balance, TDS, hardness and more
- Water quality exceedance reports for multiple water quality standards
- Automatic ready-made reports
- Integrated geochemical modelling with PHREEQC (available from the USGS)
Effortless Data Management & QA/QC
- Easily import data from various file types (.txt, .csv, .xls, .xlsx, .mdb, and .accdb) and file formats (samples as rows, samples as columns, one analyzed value for each row)
- Export stations, analysis data and geochemical plots to multiple formats, including text files, spreadsheets, images, and print-ready Office documents.
- Create simple to complex data queries and easily extract vital information about your water quality data.
Water Quality Data Analysis
AquaChem comes with comprehensive calculators and converters that allow you to perform quick, on-the-fly analyses on your water quality data.
- Unit Conversion: AquaChem manages measurement and concentration units for you – switch between mass-, molar-, and equivalent-based concentrations on the fly.
- Ionic Functions: Water Type, Electroneutrality/Ion Balance, Sum of Anions, Sum of Cations, TDS, Hardness, Alkalinity.
- General: Date functions, Exceedance counts, Total Organic Carbon, Total Organic Halogens.
- Corrosion and Scaling Indices: Langelier Saturation, Ryznar Stability, Puckorius Scaling, and Larson-Skold.
- Agricultural/Irrigation Metrics: Sodium Absorption Ratio, Magnesium Hazard, Residual Sodium Carbonate.
- Enthalpy: Enthalpy of water (liquid or vapor) based on temperature or dissolved silica.
- Isotopes: Estimates of infiltration elevation and temperature based on Oxygen-18 and Deuterium isotopic fractionation.
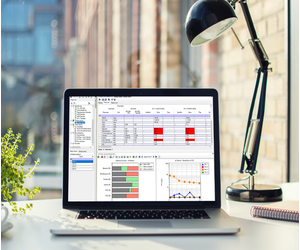
Automatic Reports
In just a few clicks, AquaChem delivers ready-made reports that contain key information about your water quality data. Fully customized layouts using the Report Designer:
- Sample Report: Generates a report for selected parameters that includes comparisons to water quality standards and summary statistics for selected samples.
- Station List & Sample List Reports: Generates a table of selected sampling stations, and generates a table of selected samples
- Sample Result Report: Generates table of selected results for the active sample
R-Console
- AquaChem includes a console that allows you to run scripts in the R scripting language and leverage the thousands of available libraries that facilitate data analyses, visualization, categorization and much more.

Geochemical Modeling (Using PHREEQC)
AquaChem includes features that integrate the functionality of PHREEQC and PHREEQCi to facilitate geochemical modelling:
- Thermodynamic Databases: manage thermodynamic databases directly in the project for improved collaboration, consistency, and project portability
- Calculate Saturation Indices and Activities: seamlessly calculate saturation indices for specified mineral/gas phases and log activities for batches of samples in a few mouse clicks and store the results directly in your project database
- Basic Geochemical Modeling using PHREEQC: develop basic PHREEQC models using a fully integrated and intuitive interface
- Advanced Geochemical Modeling using PHREEQCi: send a selected set of samples to a new session of PHREEQCi preloaded with relevant data
- Analyze & report aqueous geochemistry of supply wells
- Analytical lab results of samples from contaminated sites
- Manage water quality data from sanitary landfills
- Identify mineralization trends for mining exploration
- Analyze, interpret and plot water quality data
- Regulatory compliance with trend analyses reports
- Identify and report water quality guideline exceedances