

White-Bear - Ocean Optic View Software
OceanView spectroscopy software combines powerful data processing capabilities with a clear graphical user interface for use with Ocean Optics miniature spectrometers. OceanView is highly customizable and includes a schematic view that provides a visual roadmap of data flow from spectral inputs to processed results. OceanView delivers results in the form of an answer, rather than just a simple waveform.
-
Customizable user-interface that allows you to choose what data you want to display and which items to display on the toolbars and menus.
-
Persistence of user settings including:
- File locations
- Acquisition parameters
- Menu settings (hiding/showing of menu items)
- Graph view customization -
Capability of manually saving experiment settings (source, processing type, acquisition parameters, data view customization) and reloading them again later.
-
Ability to perform specialized calculations on spectral and other measurement data, including:
- Derivatives and integrals of spectral data
- Spectral arithmetic
- Ratiometric on the same spectrum or between 2 different spectra
- Interpolation, subsetting and concatenation of a spectrum -
Support of the following experiments/processing modes:
- Quick View (formerly Scope Mode)
- Quick View Minus Background
- Absorbance
- Reflection
- Fluorescence
- Transmission
- Raman
- Quick View Fluorescence
- Relative Irradiance
- Absolute Irradiance
- Color
- Photometry
- Concentration
- Energy, Power, Photons
- Strip Charts
- Spectral Math/Arithmetic
- Spectral Splicing
- Color
- Photometry
- Peak metrics
- Schematic view for processing spectral data on the fly and for customizing your experiment (data acquisition)
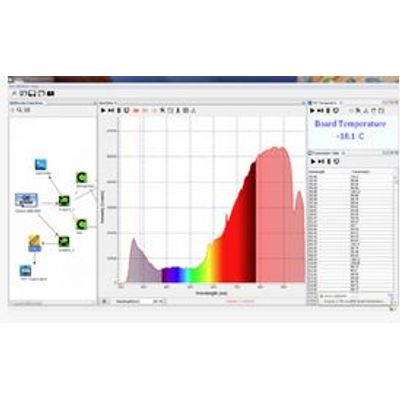
Schematic View
The Schematic View presents data from your device(s) in a diagram format. The Schematic View provides you with all of the functionality of the Window view, plus the following enhanced capabilities:
-
Algorithm nodes – allow for math functions such as ratios, adding multiple spectra, and adding a constant to spectra.
-
Set a subrange – ability to focus on a specific subset of the spectrum
-
Interpolate spectral data – evenly space data from two or more spectra to analyze them mathematically
-
Retrieve device properties such as serial number, firmware version, wavelength and total number of pixels
-
Send a single value (such as TEC temperature, integral, average over a specific wavelength range) from the device to the Scalar view to analyze the value over time
-
Preview spectra in graphs at every step in your process
-
Easily add new Graph and Table Views
Data Window
-
Unprecedented customizability with graph, table, scalar and color views
-
Used to monitor measurement
-
Provides controls to maintain measurement (e.g. store new background/reference)
-
Hides other controls to minimize clutter
-
Highly customizable with persistence to remember user settings
Platforms and Minimum System Requirements
- OceanView operates on 32- and 64-bit Windows, Macintosh and Linux operating systems.
- Monitor resolution: 1024 X 768 or higher
- RAM: 1.5 GB or higher
- Processor: Intel Core II Duo @ 1.4 GHz or better
- Intel Core Duo @ 2.0 GHz or better
- AMD Athlon Neo X2 @ 1.6 GHz or better
- Intel Atom @ 2.13 GHz or better
- AMD Athlon 64 x2 @ 1.7 GHz or better
- Note: Most processors produced in 2010 and later should be okay.
- HD Space: 300 MB free space
- OS: MAC 10.5 Intel or higher
- Windows XP
- Windows Vista
- Windows 7
- Windows 8(not fully tested)
- Linux Any version released for an x86 or amd64 platform since 2010 Example: CentOS(Version 5.5), and Ubuntu (version 10.4LTS)