
- Home
- Companies
- Cuculus GmbH
- Software
- ZONOS ReportPlus - Enables Customisable ...
ZONOS ReportPlus - Enables Customisable Analytics and Reportings Software
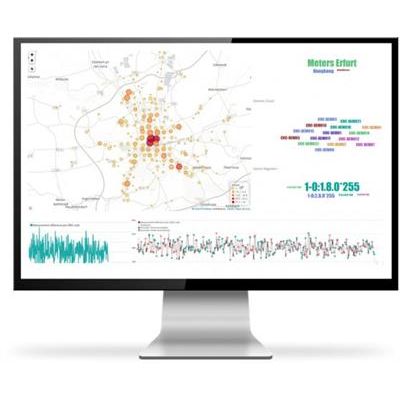
Scalable analytics for ZONOS IoT Platform. Highly customized reporting, analytics, and automations for utility data.
Extensive monitoring is essential in order to efficiently operate systems with large number of devices and customers. Flexible and powerful analysis resulting in meaningful reports is a key element to do this.
The ZONOS™ Module ReportPlus enables scheduled or event-driven generation of standardized or individually defined analysis and reports. Both design and layout of reports as well as scheduling of execution times are customisable for users.
Flexible dashboard design
Numerous components (e.g. tables, various charts, text boxes) enable users to create their own dashboards and reports to follow their business needs.
Pre-installed analysis and charts templates make it easy to get started and can be customised if needed.
Flexible report scheduling
Reports can be generated on demand, at a specified point in time or following a pre-configured time schedule (scheduling) via a GUI or a powerful REST API. The execution of a report can e.g. be set to be carried out on the 5th day of a month, daily or according to other criteria. Time zones can be taken into account. It is also possible to use a calendar-based execution to get e.g. recurring reports for dedicated months or days. Reporting periods can be defined in a flexible way when this is important for reports that cannot be run according to normal calendar intervals.
- INTEGRATIONS : Built-in integration layers like APIs, Webhooks, Kafka, Database and technology, e-Connectors etc.
- INTELLIGENT DATA ANALYTICS : GUI/querying-based reporting to combine and analyze data from multiple sources.
- MULTI-FORMAT REPORTS : Reports in commonly used formats like PDF, xlsx, CSV or graphical outputs.
- BUILT-IN VISUALIZATION ENGINE : Dashboarding engine that supports commonly used widgets and formatting options.
- SCHEDULES AND ALERTS : Automate report runs and refreshes and set up alerts for success/failed runs to keep stakeholders informed.
- GIS CAPABILITIES : Visualize data on maps with support for different mapping styles like heatmaps, bubble charts, etc.
- SELF-SERVICE REPORTING : Create custom reports for different projects in a self-service manner to ensure future readiness.
- SINGLE SIGN-ON : Built-in single sign-on support for easy access management with one credential in the entire 20NOS.
- A one-stop solution: Tested and integrated with ZONOS™ IoT Platform
- Wide range of pre-installed business area related reports and dashboard components
- Intuitive user interface allowing easy and fast adaption to address customisation needs or changing requirements
- No limitations in the number and type of reports and dashboards
- KPI ANALYSIS AND MONITORING : Create centralized reporting systems for business and operational purposes. KPIs for utilities and AMI infrastructure.
- DEVICE AND CUSTOMER BEHAVIOR : Analyze customer and device behaviors, like peak demand, by creating custom algorithms and integrating different data sources.
- EVENT AND ALARM MANAGEMENT : Manage and use events and alarms from your data using real-time and historical information from different sources, including ZONOS loT Platform to identify and maintain noncommunicating assets.
- SLA MANAGEMENT : Analyze and manage reading SLAs and general system health and statuses.
- MULTI-UTILITY SUPPORT : More than just electricity meters! ZONOS ReportPlus seamlessly adapts for water and gas meters. Explore a single platform with endless possibilities for comprehensive utility data analysis.
- AUTOMATED INSIGHTS : Efficiency meets intelligence! ZONOS ReportPlus conducts data analysis and swiftly generates comprehensive reports, empowering you to make strategic decisions seamlessly. Streamline your workflow without compromising controL