

- Home
- Companies
- Edinburgh Instruments - TECHCOMP Group
- Applications
- Time-resolved Spectroscopy of ...
Time-resolved Spectroscopy of Phosphorescent Oxygen Sensors in a Relevant in vitro Environment for Biomedical Applications - Medical / Health Care
This customer written application note details how researchers from the Air Force Research Laboratory have outfitted an Edinburgh Instruments FLS1000 Photoluminescence Spectrometer to assess candidate dissolved oxygen sensors. Available: https://www.edinsKayla F. Presleya,b, Jack T. Lya,b, James R. Deneaulta,b, Matthew J. Daltona, Tod A. Grusenmeyera
a Air Force Research Laboratory, Materials and Manufacturing Directorate, 2179 12th St, Wright-Patterson AFB, OH 45433, USA
b UES, Inc., 4401 Dayton-Xenia Road, Dayton, OH 45432, USA
This customer written application note describes how an Edinburgh Instruments FLS1000 Photoluminescence Spectrometer can be used to characterize solid sensors in a relevant environment of interest. Specifically, it describes how candidate materials for optical in vivo oxygen sensing were evaluated in a relevant in vitro environment through careful control and monitoring of the solution temperature and dissolved oxygen concentration. Sensor performance was characterized via changes in phosphorescence lifetime; these long lifetime materials were assessed using Multi-Channel Scaling (MCS) and microsecond flash lamp.
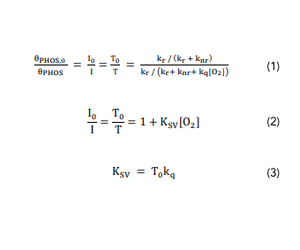
Optical oxygen sensors generally function based on incorporation of a phosphorescent molecule, such as a transition metal polypyridyl complex or heavy metal porphyrin, into a polymer mix (e.g., thin film, electrospun fibers, etc.). The long-lived luminescence from the incorporated molecule is dynamically quenched in the prescence of oxygen. Considering the phosphorescence quantum yield in the presence or absense of oxygen (Eq.1) yields the Stern-Volmer relationship (Eq.2) which governs this dynamic quenching process. Ksv represents the Stern-Volmer quenching constant and indicates the sensitivty of a given oxygen sensor to dissolved oygen in the surrounding environment. This parameter is equal to the product of the lifetime in the absence of oxygen, T0, and the bimolecular quenching constant, Kq (Eq.3)
Optical oxygen sensors can be used for both gaseous and dissolved oxygen sensing and have a wide variety of applications, such as food packaging,1 pressure sensitive paints,2 assessing oxygen levels in cell culture,3 etc. Many factors, such as the application temperature(s), the relevant range of oxygen concentrations, and the state of sensor hydration, can vary widely among different applications, and such factors can have a significant impact on sensor behaviour. Therefore, if a sensor is developed for a particular application, performing initial photophysical characterization under relevant conditions is critical.
Specifically, a hydrated 37°C environment is most relevant for many biomedical applications (e.g., in vivo tissue oxygenation sensors). Furthermore, characterization of optical oxygen sensors often takes place over a large range (e.g., 0-100% O2 for gaseous sensors), but the relevant in vivo range is much smaller. Although expected in vivo dissolved oxygen levels can vary based on numerous factors, such as tissue location, a range of ~0-90 µM, corresponding to 0-10% O2 at the appropriate temperature and salinity, should emcompass the relevant concentration range for most biomedical applications.4 However, the dissolved oxygen regime of most interest may depend on the intended application in addition to the tissue location. For example, numerous biomedical applications are specifically focused on detecting or monitoring regions of hypoxia (i.e., low oxygen levels, typically <2% O2/18 µM dissolved oxygen). Hypoxia-focused applications include monitoring critical limb ischemia,5 and identification of hypoxic regions within tumors due to their increased tendency to metastasize and resist treatment.6
This application note details how we have outfitted an Edinburgh Instruments FLS1000 Photoluminescence Spectrometer to assess candidate dissolved oxygen sensors. The goal was to assess the performance of these oxygen sensors in a relevant in vitro environment in order to evaluate their potential for use as an implantable sensor that could be used to continuously monitor tissue oxygenation in vivo.
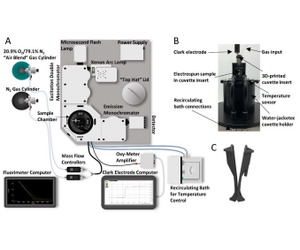
Although either intensity or lifetime can be monitored for an optical oxygen sensor (Eq.2), this experimental setup is focused on monitoring phosphorescence lifetime in order to obtain the most relevant data for the proposed application. The end application envisions a case where an implantable sensor functions alongside an external reader hat can both excite the sensor and collect phosphorescence lifetime data. Such a combination of an implantable optical sensor and an external reader has been demonstrated by Profusa, Inc. for their LumeeTM platform.7,8 Considering the application goal of an implantable sensor for continuous monitoring of tissue oxygenation, a modified experimental setup was developed to allow for relevant in vitro characterization using an Edinburgh Instruments FLS1000 spectrometer as shown in Figure 1.
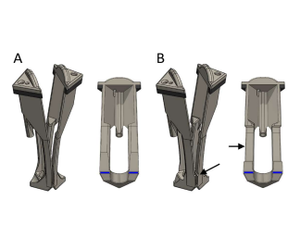
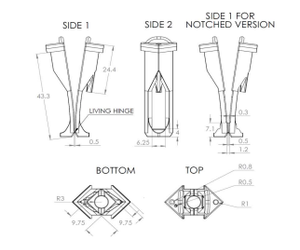
Samples are excited using either a 450 W xenon arc lamp or a pulsed xenon microsecond flashlamp attached to a double grating Czerny-Turner excitation monochromator (focal length: 2 x 325 mm, 1800 grooves/mm, 1.7 nm/mm linear dispersion). The emission signal is collected at 90° relative to the excitation source and is passed through a single grating Czerny-Turner emission monochromator (focal length: 325 mm, 1800 grooves/mm, 1.7 nm/mm linear dispersion) prior to being collected with an extended red photomultiplier tube (PMT) detector in a cooled housing unit operated at -22°C. In order to test samples at the relevant application temperature, measurements are done using a water-jacketed cuvette holder which is maintain at 37°C through the use of a recirculating bath (Lauda). Customer 3D-printed cuvette inserts were developed to mount ~ 12 x 12 mm samples within quartz cuvettes (Starna). These cuvette inserts can be used to mount freestanding thin polymer films, electrospun scaffolds, etc. Note that a notched version of the cuvette insert can be utilized to accommodate thicker samples (e.g., ~1mm thick hydrogel) or sample on a substrate (e.g., spin-coated film on a glass substrate). Assemblies of the two different cuvette insert variations are displayed alongside corresponding section view in Figure 2, while Figure 3 is a dimensional technical drawing of these designs. The cuvette insert design holds the sample in place along the cuvette diagonal such that the sample is 45° from both the excitation light source and the detector. However, the cuvette insert also functions as a cuvette lid. This cuvette insert lid contains three holes: (1) a channel-guided hole for insertion of tubing for gas exchange/bubbling (2) a hole for insertion of a micro Clark electrode and (3) a vent hole.
After the sample is mounted in the appropriate cuvette insert, the insert is added to a quartz cuvette containing phosphate-buffered saline (PBS). The dissolved oxygen concentration in the cuvette is controlled by gas mixtures introduced to the sample solution with Teflon tubing fed through the cuvette insert. Mass flow controllers (Alicat) are used to combine pure nitrogen and a custom air mixture (20.9% O2/79.1% N2) in the appropriate ratios to obtain 0.5, 1, 2, 5, and 10% oxygen at a fixed flow rate of 50 sccm. These gas mixtures bubbles into 37°C PBS correspond to micromolar dissolved oxygen concentrations ranging from ~4.5-90µM. A needle-based Clark electrode oxygen microsensor (Unisense) is used to continuously monitor the dissolved oxygen concentration within the cuvetter during measurements.
For a given dissolved oxygen concentration, the corresponding gas mixture is bubbled for at least 1 minutes prior to measurement. Intensity is monitored periodically through the use of short kinetic scans at the peak emission wavelength. Dissolved oxygen is also monitored simultaneously via the use of the needle-based Clark electrode. Once both the Clark electrode reading and the emission intensity plateau, it is assumed that the sensor is at the target dissolved oxygen concentration. At this point, a phosphorescence lifetime decay is obtained. Lifetime decays are collected using 4000 data channels and 5000 counts at maximum. To ensure that no unexpected changes in dissolved oxygen concentration occur during the measurement, emission intensity is reassessed after lifetime collection, and the Clark electrode reading is continuously monitored throughout the process. This procedure is repeated for all target oxygen concentrations. Instrument response function (IRF) curves are obtained for each decay period by setting the emission wavelength equal to the excitation wavelength, changing the emission intensity to 1% of its maximum, removing the emission filter (if applicable), and adjusting the excitation and emission bandwidths such that counts per second at <1000.
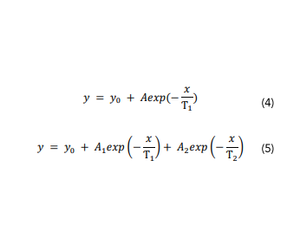
For each phosphorescence decay curve, lifetime fitting and IRF reconvolution is performed in Origin 2018b using a modified version of the fitconv function,9 or in the Edinburgh Instruments Fluoracle® software using the reconvolution fit function. Depending on the nature of the luminescence decay curve, the phosphorescence decay is fit to either a monoexponential (Eq.4) or biexponential (Eq.5) function utilizing all collected data until the point at which the intensity had decreased to a value that was between 1/e3 and 1/e5 of the peak intensity.
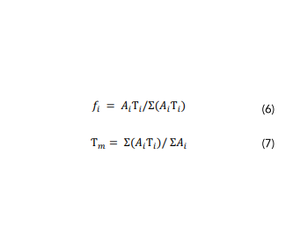
For any biexponential decay curves, the obtained lifetime parameters are used to calculate the fractional contributions of each lifetime component (Eq.6) and the average lifetime, Ƭm (Eq.7). Although multiple types of average lifetime exist, the amplitude average lifetime is utilized as this parameter is the appropriate one for direct comparison to intensity data and for use in the Stern-Volmer equation.10,11
In this manner, Ƭ or Ƭm for each evaluated oxygen concentration is obtained. However, instead of attempting a direct measurement of the hydrated Ƭ0 at 37°C, an estimated approach is generally used due to concerns over the ability to maintain and reach 0 µm O2 for these hydrated solid samples at 37°C. Such a sample configuration is not conducive to the standard freeze pump thaw approach that can be utilised for solution samples. The necessity to continuously bubble throughout data collection into a relatively small volume of solution (~2mL of PBS) is a further hindrance. These obstacles make it difficult to achieve a true 0 µM dissolved oxygen concentration, and for highly sensitive, long-lifetime oxygen sensors, even trace amounts of oxygen could lead to noticeable quenching. Therefore, the predictive method can be utilised which consists of plotting 1/Ƭ or 1/Ƭm versus dissolved oxygen concentration. If the linear Stern-Volmer relationship holds true, then the intercept of a linear regression fit would be equivalent to 1/Ƭ0. Note that the chemical scavenging approaches are a potential alternative to this predictive method.
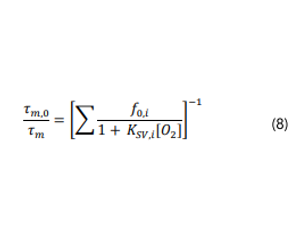
For linear Stern-Volmer plots, a linear least squares regression can be compared to Eq. 2 in order to obtain Ksv;Kq can then be calculated by recalling that Ksv is the product of Kq and Ƭ0 (Eq.3). However, note that the bimolecular quenching constant obtained in this manner is relative to the dissolved oxygen concentration in the surround solution. A “true Kq” would be relative to the actual concentration in the polymeric host which is often not feasible to determine.10 Furthermore, measures of sensitivity relative to the matrix dissolved oxygen concentration have the most practical relevance. For a non-linear Stern-Volmer plot, numerous models exist, 12,14 among the most popular of which is the multi-site model (Eq.8).15
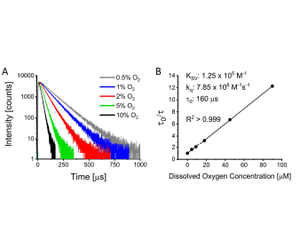
An example of a candidate sensor evaluated using the modified fluorimeter setup was electrospun biodegradable polycaprolactone (PCL) containing ~1 mM Pd (II) tetramethacrylated benzoporphyrin (PdBMAP).16 PdBMAP was generously provided by Profusa, Inc. The electrospun scaffold was ~150 µm thick and consisted of randomly oriented fibers <1 µm in diameter. The incorporated chromophore, PdBMAP, is structurally analogous to and exhibits similar photophysical properties to its parent molecule, Pd(II) mesotetraphenyltetrabenzophorphyrin (PdTPTBP).17 PdBMAP exhibits a Q-band absorption maximum at ~630 nm and a phosphorescence maximum of ~810 nm in the electrospun scaffolds.16 Therefore, it is ideal for use within the optical tissue window of maximum tissue penetration due to sufficiently low absorption and scattering.18,19 All measurements of this sample composition were conducted using an excitation wavelength of 630 nm, an emission wavelength of 810 nm, and a 715 nm long-pass filter (Thorlabs) placed before the emission monochromator. Using phosphorescence decay data up until 5 e-fold of decay had occurred, reconvolution fitting was performed in Origin.
PCL + PdBMAP was found to exhibit monoexponential decays and a linear Stern-Volmer plot (Figure 4).16 Both of these qualities indicate good interpretability and are ideal for applications focused on continuous real-time monitoring. The sensitivity was found to be fairly high (Ksv ~ 1.3 x 10⁵ M-1) and indicated good potential for monitoring of tissue oxygenation, particularly for applications focused on identification and/or monitoring of hypoxia.16 For this sensor candidate, the observed sensitivity was on the higher end of typical observed values for luminescent dissolved oxygen sensors.20-22 Note that sensitivity values can be highly dependent on numerous factors, such as the oxygen permeability of matrix, the deaerated lifetime of the employed chromophore, and the application temperature.
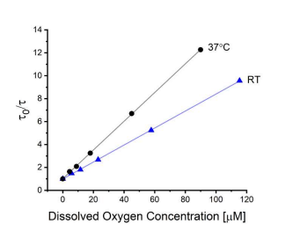
When the same sensor was evaluated at room temperature (23°C), the change in oxygen sensing performance was significant as shown in Figure 5.16 Other optical oxygen sensors have been observed to exhibit changes in sensitivity with temperature.23-25 The change in behaviour with temperature can be complicated, since the overall Stern-Volmer quenching constant (Ksv, the slope of the Stern-Volmer plot) is equal to the product of the bimolecular quenching constant and the deaerated lifetime (Eq.3). An additional relevant factor is the change in oxygen solubility with temperature. In this case, two competing factors were (1) the decrease in Ƭ0 with temperature and (2) the enhancement of Kq with temperature. The former is expected to be a result of an increased rate of non-radiative decay, while the latter is hypothesized to be related to oxygen diffusivity increasing with temperature. Considering the Smoluchowski equation, the bimolecular quenching constant is directly proportional to the diffusivity of oxygen within the environment.26 For this particular sensor, the enhancement in Kq with temperature (4.1 x 10⁸ to 7.9 x 10⁸ M-1s-1) was more significant than the decrease in Ƭ0(181 to 160µs), resulting in an overall effect of increased sensitivity (Ksv changing from 7.4 x 10⁴ to 1.3 x 10⁵M-1).16 Overall the significant difference in sensor performance observed with a <15°C change in temperature demonstrated the importance of performing senso characterization at the proposed application temperature.
This customer written application note detail how the FLS1000 Photoluminescence Spectrometer was outfitted to allow for thorough in vitro characterization of optical sensors in an environment that is relevant for their proposed application. Specifically, it describes how candidate tissue oxygenation sensors can be evaluated at carefully controlled and physiologically relevant dissolved oxygen concentrations. Characterization of an example candidate sensor is presented. The change in sensor performance with temperature is also demonstrated to highlight the importance of characterizing optical sensors at a temperature relevant for their proposed application.
- S. Banerjee, C. Kelly, J.p. Kerry, D.B. Papkovsky, High throughput non-destructive assessment of quality and safety of packaged food products using phosphorescent oxygen sensors, Trends Food Sci. Technol. 50 (2016) 85-102.
- M. Akram, M.H. Akhtar, M. Irfan, Y. Tian, Polymer matrix: A good substrate material for oxygen probes used in pressure sensitive paints, Adv. Colloid Interface Sci. 283 (2020) 102240.
- S. Matsumoto, E. Leclerc, T. Maekawa, H. Kinoshita, M. Shinohara, K. Komori, Y. Sakai, T.Fujii, Integration of an oxygen sensor into a polydymethylsiloxane hepatic culture device for two-dimensional gradient characterization, Sens. Actuators B Chem. 273 (2018) 1062-1069.
- A. Carreau, B.E. Hafny-Rahbi, A. Matejuk, C. Grillon, C. Kieda, Why is the partial oxygen pressure of human tissues a crucial parameter? Small molecules and hypoxia, J. Cell. Mol. Med. 15 (2011) 1239-1253.
- M.F. Montero-Baker, K.Y. Au-Yeung, N.A. Wisniewski, S. Gamsey, L. Morelli-Alvarez, J.L Mills Sr, M. Campos, K.L. Helton, The first-in-man "si se pueda" study for the use of micro-oxygen sensors (MOXYs) to determine dynamic relative oxygen indices in the feet of patients with limb-threatening ischemia during endovascular therapy, J. Vasc. Surg. 61 (2015) 1501-1510.e1.
- R. Xue, M.T. Nelson, S.A. Teixeira, M.S. Viapiano, J.J. Lannutti, Cancer cell aggregate hypoxia visualized in vitro via biocompatible fiber sensors, Biomaterials. 76 (2016) 208-217
Further references available: https://www.edinst.com/time-resolved-spectroscopy-of-phosphorescent-oxygen-sensors-in-a-relevant-in-vitro-environment-for-biomedical-applications/